WatchPoint

L3: The Lightweight Logging Library for Debugging C/C++ Races Conditions
As you’ve probably noticed, I like to hate on printf-debugging. I believe far too many programmers turn to it as their technique of first report; it should be the technique of last resort. But, sometimes, it’s all we have. Notably when for some reason we are unable to reproduce or investigate a bug with more sophisticated tools, such as debuggers, dynamic checkers or time travel systems. A common example of this is a race condition or other very rare issue that occurs only in production, under extreme load, and very rarely and unpredictably. In these cases even printf can often let us down: adding printf’s can make the bug stop happening, or change in nature. This is because the printf is slow, and it takes a mutex, and so becomes a synchronization point. It doesn’t need to be that way. So my friend Aditya Gurajada and I created a lightweight logging library that is both fast, and lock free. We call it L3. You can get it from github here: https://github.com/undoio/l3. The In this tutorial we are working with an example program in C: We can compile and run this example program: This will give no output, as L3 has logged the values to The output here requires post processing using the l3_dump.py utility, to which we give the binary log and the executable file: L3 is very simple. It essentially does the following (the actual code is slightly more complicated, but below contains the key idea): The The post-processing is actually the most complicated bit. Writing a pointer to the string literal into the array as we do, rather than Compared to standard printf debugging, L3 is much faster and lock-free, taking as little as 2ns per log message (compared to over 50ns for a regular, buffered That’s it. It’s almost too simple to warrant calling a library. I dare say something like this has been written hundreds of times before. But I couldn’t find anything out there quite like it, so I hope it will be useful for some people. l3_log() function is somewhat limited: the first argument must be a string literal, followed by up to two scalar arguments (char, int, long, uin64_t, etc). It also requires a post-processing step to get the log into human-readable form. These limitations however are a feature not a bug: they permit a super lightweight implementation, typically just 2ns for an l3_log() call! This compares with about 80ns for an in-memory printf. And unlike in-memory logging, there is no separate log flush required, so no truncated logs when your program crashes.Using L3
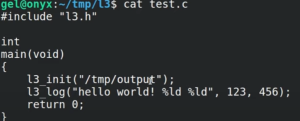
$ gcc -Iinclude test.c src/l3.c

$ ./a.out
/tmp/output. If we look at this output, we see that it is given as a binary file:$ less /tmp/output

$ ./l3_dump.py -h

$ ./l3_dump.py –log-file /tmp/output –binary a.out

How does it work?
void

l3_log(const char *msg, long arg1, long arg2)

{

   static __thread pid_t my_tid;

   if (!my_tid) my_tid = syscall(SYS_gettid);  // Stash tid in TLS

int idx = __sync_fetch_and_add(&l3_log->idx, 1) % L3_MAX_SLOTS;

   l3_log->slots[idx].tid = my_tid;

   l3_log->slots[idx].msg = msg;

   l3_log->slots[idx].arg1 = arg1;

   l3_log->slots[idx].arg2 = arg2;

}
l3_log global points to a file-backed memory map that is basically an array of structs. The __sync_fetch_and_add() is what gives us our thread-safe, lock-free implementation to get a slot into the mmap’d array. my_tid is thread-local variable to avoid needing to make a syscall each time (just once per thread).Post-processing: l3_dump.py
strcpy’ing it, is one of the tricks that makes L3 fast. The string literal itself will be a pointer to a string in the program’s read-only data segment. l3_dump.py uses the readelf utility to find the offset of that segment in the program binary, and subtracts this address from the string literal pointer to get an offset into the read-only segment from which it can extract the string literal. It’s a little fiddly, but it’s not complicated, and it works well.Conclusion
fprintf().
Get tutorials straight to your inbox
Become a GDB Power User. Get Greg’s debugging tips directly in your inbox every 2 weeks.
Want GDB pro tips directly in your inbox?
Share this tutorial