Resources
Resolve difficult EDA software failures in production faster
 Production failures that emerge at a customer site are a huge challenge for EDA vendors. There is a horrible tension between customers (semiconductor manufacturers or FPGA users) who want to keep their IP safe, EDA vendors wanting to do the same, and the need for customer issues to be diagnosed and solved quickly.
Finding the root-cause of a software failure or misbehavior is critical to ensuring customers can continue their time-critical design work.
So how can EDA software vendors resolve customer issues quickly so their customers get their chips to market faster and keep to their fabrication deadlines?
An archaic debugging workflow
Resolving a critical bug fast can be a real challenge – sometimes requiring repeated time-consuming visits to the customer’s site. This is due to a variety of limitations put in place, to protect customer (and EDA vendor) IP:
- No parts of a customer design can ever leave the customer site – though they can be viewed in situ with a supervising engineer; alternatively, the customer creates a “secure chamber” which the EDA vendor can log into
- For some customers, even log data from the EDA application must remain on customer site
- It takes multiple approvals to install new software on customer site, so the process to install a debug build is sometimes laborious
- Where debug builds can be shipped to customer site, the EDA vendor is often exposing their IP by including their symbol files which they must then carefully manage to try and protect their IP
Currently, EDA vendors use 3 main solutions to resolve in-production failures:
The issue can easily be reproduced within Core Engineering
Core Engineers manage to reproduce the issue in-house in such a way that doesn’t involve customer IP and they ship the fix back to customer site. This is great when it works, but not always possible, and if they can write a reproducer they have often already fixed the problem.
Remote session
If the problem cannot be reproduced in-house or diagnosed from logging output, a customer may set up a secure environment that the vendor can then access remotely via a VPN connection. This ‘secure chamber’ approach gives access to the customer’s environment, allowing them to view the problem in-situ. However, this requires considerable effort on the part of the customer to set up (as well as the on-site FAE!) and requires the original problem to be recreated, which for long running and hard to reproduce issues may add considerable delay to the eventual fix.
Sending R&D engineers on customer site
If the first two options don’t resolve the issue, EDA vendors sometimes resort to sending their R&D engineers on customer site. But it can get expensive especially if there’s a long runtime and engineers end up on site for many days. It also impacts on the roadmap development schedule back at base.
Whether engineers go on-site or debug using secure chamber, symbol files need to be sent to the customer site prior to the debug session. Some vendors arrange for debug builds to be sent as well – which is non-trivial. Unfortunately it is not uncommon for FAEs to forget to delete the debug build binaries and symbol files. Leaving symbol files behind is a real issue because the same physical systems at the customer site can be used by multiple EDA vendors.
A paradigm shift: time travel debugging
Thankfully, there’s a new way to debug challenging production defects. This new solution mirrors the diagnostic capabilities that a black box provides to aerospace engineers. Time travel debugging is based on a program execution ‘record & replay’ engine that can record a failure as it happens – capturing the problem “in the act”. The recording can then be replayed as many times as needed to see the contents of any memory location at any point in the program’s execution history and get to the root cause of the problem – fast and with certainty.
Time travel debugging offers complete visibility into the factors that led up to the failure. But it also eliminates the need to spend days or weeks trying to – or worse failing to – replicate the issue. Engineers now have a recording artefact that serves as a standalone 100% reproducible test case, allowing them to fix failures and resolve customer issues faster and more reliably than ever before.
The beauty of this technology is that it allows EDA vendors to ship a full debug solution to customer site without the need for any IP to leave customers’ premises. EDA vendors no longer have to be exposed to their customers’ IP and no longer need to expose their own IP to their customers. Indeed the full bug reproduction and debug workflow can now be carried out on customer site.
How does time travel debugging work?
Let’s look at Undo’s LiveRecorder to resolve this type of software reliability problem. LiveRecorder comprises:
- LiveRecorder: integrated directly into your product so it can record program execution as it fails
- Undo Player (a functionality that comes as part of the LiveRecorder product): used to replay the recording files and reverse-debug the recordings
LiveRecorder protects EDA vendors from disclosing IP in an environment where their competitors also operate. By allowing EDA vendors to encrypt their symbol files before they ship to customer site, and only allowing decryption with a password inside Undo Player, there are never decrypted symbols on disk at customer site.
The diagram below shows schematically how the different components in LiveRecorder relate to one another.
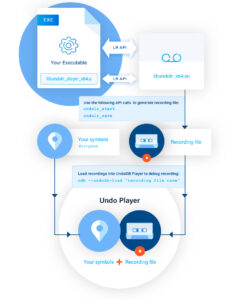
The application links to an Undo supplied shared-library, which contains the LiveRecorder functionality. Using the LiveRecorder API, the application can control when the recording is started and stopped, change the recording configuration and decide when the recording is written out to disk.
The Undo Player binary files are distributed as part of the EDA application. Although Undo Player is a fully-functional debugger, it can only load recordings made by the application and cannot attach to an arbitrary process. This is enforced during the integration step to ensure that Undo Player is tied to the application that generates recordings.
There is no requirement for off-site license validation by Undo Player, so there is no need for any external network access, which might otherwise be problematic when the application is running at a secure customer location.
It’s common practice for a debug version of the application to be installed at the customer site to aid with debugging the problem. However, getting new artefacts to the customer can be logistically difficult; and getting permission from the customer can also be tricky. Rather than relying on a debug build, it can be more convenient to load debug symbols into Undo Player separately – allowing the original optimized application to be debugged directly.
However, uploading debug symbols to the customer site often faces the same logistical issues as uploading a debug build. To counter this, Undo supports the use of encrypted symbols that can be distributed with the original application files and then securely loaded into Undo Player when a debug session is started.
The symbols are only ever decrypted in-memory within Undo Player, so there is no risk that they would be exposed on disk to third parties. Providing symbols when they are needed reduces the debug effort and the time taken to find the root cause of a problem.
The icing on the cake
But there is more…
Sometimes EDA vendors’ customers have their own proprietary libraries that they link in to the EDA vendors’ code, and there is a difficult task to determine where the problem lies. With LiveRecorder, semiconductor developers can look at a recording whilst EDA vendor engineers look at the same recording… and both parties can see their own source code, but they can’t see each others. This method of working allows close collaboration between the EDA and semiconductor developers while maintaining the integrity of both parties’ IP.
Conclusion
Finding the cause of an application failure in an IP sensitive environment is complex and time-consuming. Time travel debugging provides a workflow that allows engineers to diagnose and fix defects faster and more efficiently – without having to upload debug builds or remove sensitive information from the customer’s site.
Once a defect has been recorded with LiveRecorder, there is no longer a need to reproduce it in the original application – thereby reducing the number of debug sessions with the customer and speeding up the debug cycle. The recording can be loaded into the Undo Player at the customer site for a fully interactive debug session, leading to rapid and effective solutions to the failure.