Make bugs 100% reproducible and start debugging failures instantly
LiveRecorder provides a one-click workflow from a test failure to a time-travel debugger placed exactly at the point of failure – skipping the tedious steps usually required to reproduce the problem and enabling developers to start debugging test failures instantly.
Developers working on complex C/C++/Go/Java software can now save a huge amount of time diagnosing the root causes of new regressions, legacy bugs, and flaky tests. Bugs that took days or weeks to fix can now be resolved in hours.
Built for heavily multithreaded applications, multiprocess programs, software using third-party components (e.g. open source), or single-threaded large legacy codebases.
Watch the Demo
25–0%
of developer time
is spent on debugging rather than innovating
0%
of software developers admit
to having defects which remain unresolved because they cannot reproduce the issue
0%
of software vendors
have experienced issues in production related to previously seen but unfixed test failures.
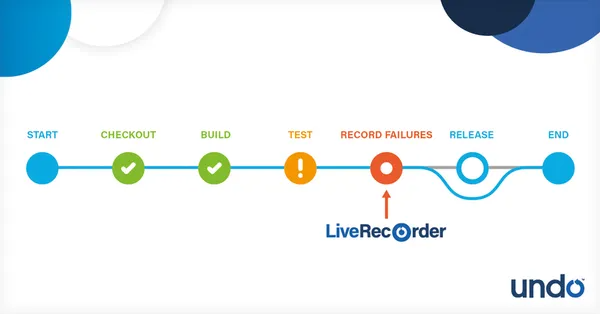
Record CI / System Test failures
Automatically record CI / System Test failures to capture the execution of failing test runs, including intermittent failures. Recordings capture all non-deterministic data (down to instruction level) and recreate your application’s entire memory and the register state – on demand and with minimal overhead.
No time needs to be spent reproducing the issue or any environmental conditions that contributed to it. Developers can start debugging test failures instantly.
Store the recordings in your CI or bug-tracking system for later analysis and cross-team collaboration.
LiveRecorder integrates with all popular CI automation tools, including Jenkins, Maven, Circle CI, and TeamCity. The core recording technology is language independent and compatible with most mainstream Linux distributions.
Replay recordings anytime, anywhere
Launch a ready-to-go debug session in your browser with a one-click workflow: Jump from a test failure (or bug report) straight into a fully set up replay session of the recording that captured the bug. The in-browser debugger is based on Visual Studio Code (with Undo-specific additions/alterations), providing an easy-to-use UI to debug.
Debug locally or remotely: Recordings are portable, allowing developers to debug anytime and on any machine (out of the original environment).
Collaborate across teams and time zones: Recordings are shareable for effective asynchronous collaboration (share recordings, add comments, etc.).
Debug the recording with time travel debugging
Analyze execution history and get instant visibility into what your program did, and why.
Debug a failed CI or QA run from days, weeks, or months ago. The application behavior is 100% reproducible each time the recording is replayed.
Time travel debugging C/C+
Go back to any point in your application’s execution history and inspect the complete state of the application at that point, including the contents of all variables and the heap.
Use the full range of debugger functionality to navigate your application’s execution: stepping, running, breakpoints, watchpoints, catchpoints, etc., but in reverse as well as forward. (a.k.a. reverse debugging).
Navigate through your application’s execution history in ways simply not possible in a conventional debugger: e.g. spot a line of interest in a log file, then jump inside a recording to the point in time when your application emitted that log line, or jump to the previous time the application made a particular system call.
Time travel debugging Java
LiveRecorder also supports Java applications.
LiveRecorder for Java is the most effective way to debug complex Java apps and boost developer productivity. Record, replay, and resolve concurrency defects, intermittent failures, and uncaught exceptions.
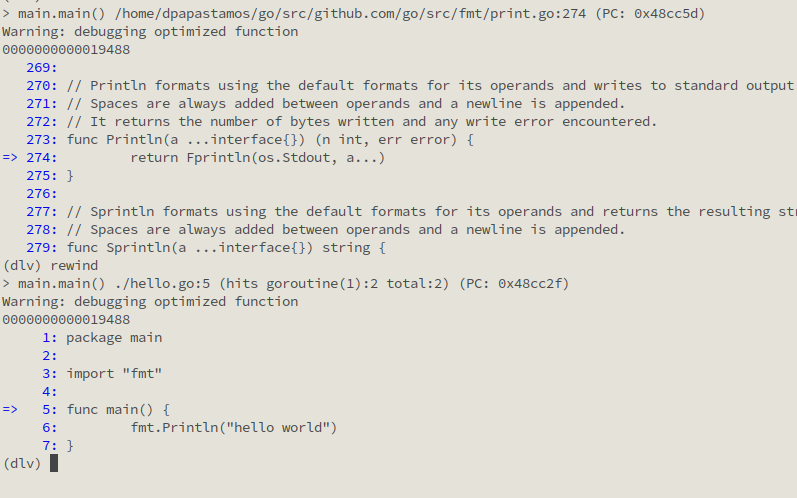
Time travel debugging Go
Simply rewind and replay the recording with Undo’s version of Delve as the backend.
Step backward as well as forward in the code to find the root cause of the problem.
Visit the documentation website to learn more.
LiveRecorder features
LiveRecorder comes packed with enterprise features to handle even the most complex of applications – including heavily multithreaded or multiprocess applications, programs running on the cloud, virtual environments, etc.
Faster Than You Think
Time Travel Debugging
Multi-Process Correlation
Thread Fuzzing
Integration and Control
Compiler- and Library-Agnostic
Log Jump
Post Failure Logging
Dynamic logging
LiveRecorder vs. traditional debugging
Before LiveRecorder
Lengthy multiple iteration process, reliant on guesswork
Root cause analysis can be frustrating. It takes a disproportionate amount of time. You get stuck in a “add logging-rebuild- re-run-add more logs” loop. Or you step forward in a debugger…until you step too far and you have to restart again.
With LiveRecorder
From symptom to root cause in a single debug cycle
LiveRecorder makes debugging predictable. You reproduce the issue once and debug the recording (which shows you exactly what happened). The recording will always behave in the same way anytime, anywhere, and for everyone. No more “works on my machine!”.
Bug capture (including intermittent bugs) is automated
Explore how the code is executed dynamically - every line of code in every thread, every variable, every I/O
Go back to something that happened last week/month
Allows collaboration on the same issue
See what the software really did (not what it was expected to do)
What customers say
Common questions
Here are some frequently asked questions and answers you may find helpful. Detailed technical documentation is also available in the Docs
Didn’t find the answer to your question? Ask below and we’ll get back to you shortly.
We use binary instrumentation to capture only the bare minimum data required to record execution as efficiently as possible. To keep the overhead low, we don’t translate instructions that don’t require it.
The recording contains all information required to recreate the entire memory state of the recorded process at any machine instruction that was recorded. This includes memory maps, any data read from the file system, network or the kernel generally, and the executable and libraries that were involved with running the application.
LiveRecorder works with normal releases without any code or build changes, so you don’t need to modify your code and you need to recompile.
LiveRecorder is capable of handling multithreaded applications. Some of our customers record applications with 30-40 active threads and 100s of less active threads. For example it is used on SAP HANA – a heavily multithreaded application that uses custom memory allocators, custom threading libraries and that typically runs on a machine with 100s of cores and terabytes of RAM. Read case study
We don’t usually recommend running all your regressions under recording because the overheads can be significant. Instead, do 2 things:
- Configure the test system to re-run failing tests under recording (often up to some upper limit of iterations or for some fixed length of time to catch flakiness)
- Create a subset of regression tests that are known to be flaky, and run them repeatedly with recording enabled.
The first is useful for a “pre merge” flow; the latter for if you have a “flaky test problem” (which most engineering teams do to some degree).