Resources
5 Tips to Debug Faster with UDB
Find a memory corruption with one command
Tracking down unexpected values in memory is like looking for a needle in a haystack. The bad write is often nowhere near where the error shows up. In the most frustrating cases, the corruption may have happened minutes (millions of lines of executed code!) before the crash.
An Undo recording can answer any questions you have about program execution.
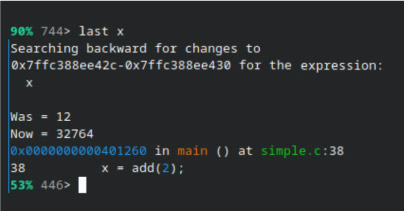
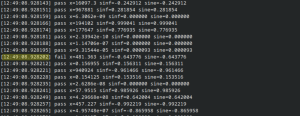
Use the “last” command to find out when a bad value was written. This rewinds history to take you directly to what you want to see – the code that last changed a variable:
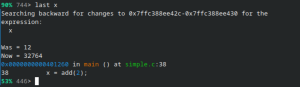
last remembers what data you’re looking at between invocations, so you can resume your search backwards by simply running it again without arguments. It stops automatically on allocations and frees affecting the locations of interest, so you can catch memory management bugs in the act.
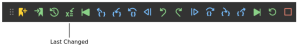
If you’re debugging via VS code, the same functionality is available via the toolbar:
Use last to quickly understand what is modified and where when investigating how complex data structures are changed.
Keep notes about your debug session
Fixing bugs can be painful because of all the context to cram into your head – even tiny distractions can make it fall right out again. Bookmarks help you track your discoveries in a debugging session.
To create a bookmark, accompanied by an optional name / description, use the ubookmark command:
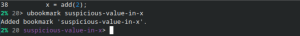
Notice that the status prompt now indicates that you are at a bookmark.
You can jump quickly to critical points in a recording using the ugo bookmark command and resume your debugging from there:
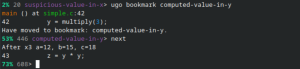
Get an overall picture of your investigation with the info bookmarks command:
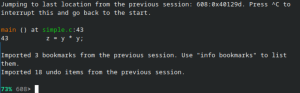
If you’re working on a recording file, your bookmarks (along with your current set of breakpoints, your current point in the recording, etc) will be restored next time you load the recording, so you can regain your momentum quickly when returning to a problem:
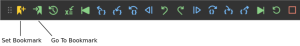
Bookmarks are also available in the VS code debugging toolbar:
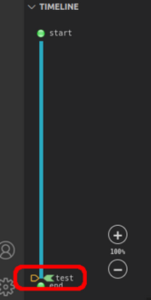
Bookmarks you create will show up in the Timeline window:
Use bookmarks to structure your thoughts, remember clues for later and solve your bugs faster.
Share your debug session with colleagues
It’s often necessary to work on code you don’t understand – and maybe nobody in your immediate team does either. By sharing your debug session state, you can collaborate to solve the hardest problems.
The usession export command generates a JSON file containing session state information. By default it will use the same base name as the recording you are working on:

You can share the recording file and session state with any developer – Undo recordings are portable, so they will see exactly the same behaviour you are looking at.
Your colleague can load this state using usession import:
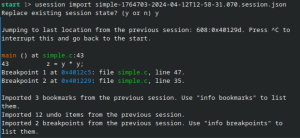
Session state files contain a UID to associate them with the corresponding recording, so you won’t be able to mix the wrong state with a recording. Once imported, their local copy of this state will be used each time they load the recording.
Use session sharing to share your current analysis with another expert and swap theories or to give a code walk-through to a new teammate.
Recover from your debugging mistakes
“Oh no! I’ve stepped too far.” Without time travel, this means you have to restart the whole debugging process again. If it took 2 hours to get to that point then that time was wasted.
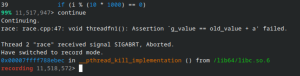
With a recording, the complete history of the application is always available – you can always go back and review things you missed earlier. But it’s still frustrating to land somewhere unintended in the code (for instance because we forgot to set a breakpoint):
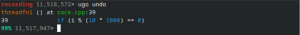
We can use ugo undo (or uu for short) to undo the most recent time travel command (including standard stepping operations):
The ugo redo command (or ur for short) to redo the most recent time travel command. The history used by these commands is saved persistently (as with bookmarks) so it’s available when you reload a recording you were previously using.
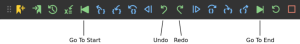
In VS code, these commands are available in the debug toolbar, along with other time travel shortcuts:
This gives us something like “browser history for debugging”, so you can explore history freely without having to be cautious in case you go too far and miss something.
Match an Undo recording with a log file
A text-based log file can be the first clue in a random, hard-to-reproduce test failure. If the failure was also captured with Undo then we can use timestamps from the log to jump straight to the interesting part of the recording.
When we’ve got a random failure that can’t be reproduced, this helps us understand why the log said what it did without having to recompile to add more logging.
Here’s an error in some timestamped logs:
If we have an Undo recording from the run that produced the logs then we can jump straight to this error. Load the recording into UDB and paste the time of interest into the ugo wallclock command:
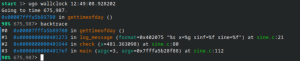
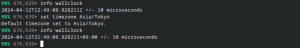
We’ve jumped straight into the code that produced this line of log output. We can debug from this point to find out more, just as if the process was live. If we reach something interesting in our debug session we might want to look up what happened in the logs around that point in time. Do this with the info wallclock command:

This returns an estimate of the current wallclock time, so you can refer back to your log files.
You can use the info wallclock-extent command to check what range of wallclock time the recording actually captured:

Finally, if your timestamps don’t include a timezone (and you’re not in the default UTC timezone) then you may need to set one manually – use the set timezone command:
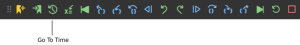
In VS code, the debug toolbar provides access to this feature:
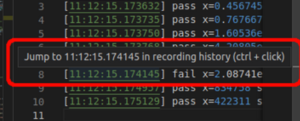
You can also ctrl-click on a timestamp in a log file (or the terminal) to jump straight into recorded history without having to copy-and-paste:
Use these features to combine the strengths of debug logging with those of time travel debugging.