Make coding agents work on your complex codebase
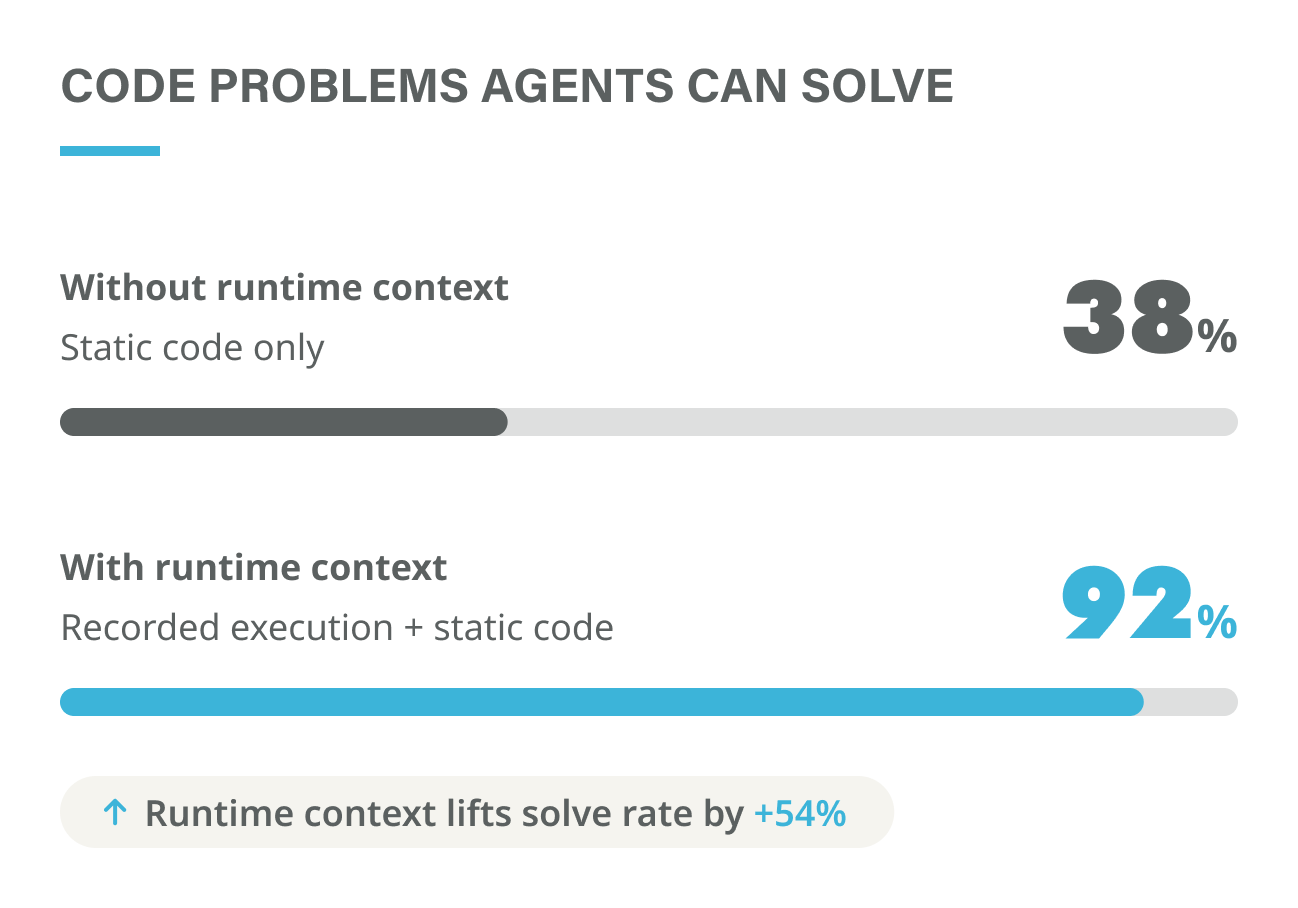
Undo feeds AI agents the runtime context they need to understand what actually happened and perform fully automated root cause analysis
TRUSTED BY INDUSTRY LEADERS


AI = Model + Context
The bottleneck isn’t the model. It’s the context.
The hardest problems in million-line codebases live in runtime state:
- Execution paths
- Non-deterministic inputs
- Values flowing across module boundaries
- Effects far from their cause
Source code can’t show this. Logs don’t capture causality.
So agents fill the gap with plausible guesses, and engineers can’t tell the good answers from the hallucinations.
The antidote to hallucination

Undo records complete program execution:
- Every instruction
- Every variable
- Every thread event
- Every system call
Unlike logs, recordings capture causality. Unlike traces, they’re complete. And unlike a live debug session, they’re deterministic. Replay the recording, and the program behaves identically, every time.
Agents query the recording the way they already reason about static code. Now they can answer the questions source code alone never could:
- Why did this variable change here?
- What caused this null pointer dereference?
- What was the thread state when the crash occurred?
No more guessing. Just the truth about what your program actually did.
Delivered via MCP
Any coding agent can query a recording for exactly the context it needs.
Recordings are self-contained and portable. Capture a problem in development, test, or production, and analyze it anywhere.


Why engineering leaders choose Undo
100x faster diagnosis of production problems
Accountability restored
Stable, maintainable codebases
AI spend under control
See what others say

Before Undo AI was introduced, I would have taken 1 to 2 days to debug things. With it, we got the exact root cause in 15 minutes.Read full case study
Harshith K

Undo helps you get way more productive. It enabled us to iterate more quickly and to deliver higher-quality in less time. We’re spending less time on debugging and troubleshooting and we can focus on creating new software and providing value to our customers.Watch success story video
Alexander Boehm

We used Undo to locate the root cause of the memory corruption and the logical errors. Without Undo, it would have taken significantly longer to get the right set of data to solve such issues, which typically could be upwards of a week.Read full case study
Ajit Kumar Rajah

Our software is running on distributed servers and interacts asynchronously; so when bugs occur, they are hard to catch. We use Undo to radically accelerate the fixing of intermittent or hard-to-reproduce bugs.
Fritz Ferstl

Since using Undo, customer satisfaction has gone up and turnaround time of fixing bugs comes down drastically. Problems that used to take weeks to solve can now be solved in days.Watch full interview
Arun Venkatachar
Many real-world programs can be recorded running at better than half-speed. Others will be a bit worse – in general, expect 1.5x-5x slowdown per thread (YMMV).
Undo’s dynamic just-in-time instrumentation captures only the minimum data required to replay the process – 99% of the program state can be reconstructed on demand, only the non-deterministic inputs need be recorded.
Undo provides an MCP server that works with any coding agent that supports MCP, including Claude Code, Cursor, Windsurf, GitHub Copilot, Codex, and Gemini.
The agent queries the recording for exactly the context it needs — no special integration work required.
Undo’s customers record applications:
- with dozens of active threads and 100’s of less active threads
- using custom memory allocators, custom thread libraries
- running on machines with 100’s of cores and terabytes of RAM
For example, the SAP HANA Cloud engineering team invests in the most advanced technologies to ensure stable releases. The team uses Undo’s time travel debugging (combined with thread fuzzing) to debug their highly-multithreaded application with around 5 million lines of productive C++ code. No known bug remains unresolved.
To record memory states, the Undo engine relies on the copy-on-write semantics provided by the operating system, so the memory footprint can be kept relatively low (typically 2x that of the process you are recording).
We can also tune Undo’s behavior adaptively to available RAM.
Undo comes as on-premise software, so your data lives with you.
A good proportion of our customers use Undo in production to resolve customer issues orders of magnitude faster than with decade-old debugging practices.
👉 Check out customer stories from Synopsys, Siemens EDA, Cadence or Altair
Undo has the technology to record almost any kind of interaction between the process being recorded and the kernel.
Some of Undo’s customers are networking companies, using very specialized hardware and kernels. Some kernel interactions involving custom devices require optimization by Undo to have good reliability and performance.
Yes – with Undo, you can record multiple, communicating processes running as part of a larger service and then debug them all from the comfort of your development machine.
No need to attach a debugger to multiple nodes of your cluster or to pause components whilst the system is in operation.
Watch this video for an example that traces a bug to the originating node – and to the bad source line – within a distributed C program.
No. No kernel changes or settings, no kernel modules. No special compilation steps either. It just works.
Yes, we just supply an MCP server that makes your AI coding assistant smarter.
It works with any coding assistant of choice (including Cursor and Windsurf).
Undo’s software is designed for Linux, running on x86, x86_64 and ARM64 devices.
We don’t support Risc-V, PPC or MIPS. We cannot record on Windows, MacOS, any of the BSDs or any other OS that is not Linux. On Linux we do support a huge variety of kernel versions and distros.
We cannot record code executed by GPUs, but we can record the CPU side of the interaction with a GPU and, sometimes, that’s all you need.
Ready to explore further?
- Super-charge your AI model with the best guardrails you can provide it: runtime context
- Ensure AI slop doesn’t impact code maintainability
- Set up fully automated root cause analysis in your CI/CD workflow
- Resolve production issues before they turn into escalations