Intro to Time Travel Debugging
Understand complex code and fix bugs faster
Overview
Over the last decade, software development has become mind-blowingly complex – as have the challenges related to finding and fixing bugs.
Traditional methods of debugging and analyzing code are no longer sufficient for the challenges of understanding complex codebases and debugging modern applications.
It’s time to upgrade to time travel debugging.
- Get changes into the pipeline faster
- Complete your code deliverables on time
- Resolve customer-reported defects in hours, not weeks
Debugging is a costly productivity killer
As the world becomes increasingly dependent on software, finding and fixing software failures in complex systems has moved from being an inconvenience to a major problem. Most developers are now spending most of their time debugging.
While tools exist to prevent bugs when coding, there has been little innovation in tools that help with debugging once these bugs surface.
Aside from debugging issues taking far too long, unresolved failures negatively affect trust in your codebase, customer experience, and company reputation.
Why it’s time to transform the way we debug
There is a range of traditional options and approaches currently available to developers to help diagnose errors in a codebase.
| Method | Pros | Cons |
|---|---|---|
| Programmatic techniques Assertions and the use of test suites |
Developers modify or write their program in a way that helps them to better observe their code Improves overall code quality and understandability |
Requires codebase knowledge Limited for finding certain types of bugs |
| Logging Log of program execution |
Easy to use – every developer knows how to insert logging statements into their code (e.g. printf in C or log4j in Java) Easy to navigate and understand program execution Provides clues about what went wrong |
Limited in use – not good for thread-related issues Snapshot only – can’t tell you the value of variables over time Difficult to determine exact root cause |
| APM | Valuable for detecting that a problem has occurred | Precise root cause still needs to be investigated and tracked down |
| Special case analysis tools Automated tools (e.g. as Coverity, SonarQube, Valgrind, AddressSanitizer, ThreadSanitizer) | Detect common bugs (e.g. memory access violations, touching unallocated memory, or potential deadlock conditions) |
They can only detect those errors that they are designed to detect False positives create “noise” in reports, which can drown out the real errors |
| Debuggers Traditional cyclic debugging (e.g. GDB, native IDE debuggers) |
Step forward, inch by inch, to examine code Stop execution at a given point to investigate where it goes and what the values are Can be used as command line or in IDEs |
Slow, iterative process May require effort and additional tooling to enable developers to reproduce an issue Not suited to error resolution in live production environments Can’t provide any historical information (“what happened?”) |
Logging statements
Logging and printf statements can have their benefits, but when you start spending hours modifying your binaries and recompiling multiple times to try to get more clues, this process can quickly turn into days of wasted effort based on guesswork.
Traditional debuggers
Debugging is about finding out what happened. But traditional debuggers (GDB, VS Code integrated debugger etc) only tell you what the program is doing right now, instead of what the program did before it went wrong.
GDB in particular can be painful to use: you have to restart repeatedly and it doesn’t easily give you the information you need to find the problem. A lot of reproducing the issue over and over again, a lot of stepping-in and lots of “Oops, I’ve stepped over too far. Now I have to restart.” Working this way is time consuming and inefficient – not ideal when you’re under time pressure to fix an issue.
The reality of debugging in 2025
Traditional tools and methods for debugging and analyzing code are no longer adequate for the challenges of understanding complex codebases, and debugging modern applications. Despite seeing huge changes over the last few decades in methods of program development, traditional debugging has not evolved in parallel. Debugging code through iterative, line-by-line guesswork has not scaled well with increased application complexity, which can now involve multiple threads on multiple processors, terabytes of data, and billions of instructions from multiple sources.
Traditional debugging techniques no longer fulfil the job of delivering better software, faster. And they certainly don’t meet the needs of developers working on codebases with millions of lines of code. Finding the root cause of complex issues like memory corruptions or race conditions in a large and often complex codebase is like finding a needle in a haystack.
It’s time to upgrade our method of debugging by half a century!
What if developers could simply time travel backward through their code to see exactly what went wrong, instead of having to try and reproduce errors before figuring out what actually happened, and why?
Time travel debugging is a game changer
Time travel debugging (TTD) is the ability to wind back the clock to any point in an application’s execution and see exactly what the program was doing. Integral to TTD is the ability to reverse debug through program execution history. It allows a program’s execution to be recorded and subsequently replayed back and forth as much as needed to understand what the software really did.
This transformative debugging capability allows you to observe and understand the precise conditions that led to a specific bug. By letting you rewind the programmatic execution path directly back to the root cause, TTD accelerates finding and fixing bugs. It is also a powerful way for you to learn about code flow in a million+ line codebase you didn’t write.
Take an example use-case of tracking down some corrupted memory. With time travel debugging, you can put a watchpoint (aka data breakpoint) on the variable that contains bad data, and run backward to go straight to the line of code in the thread that most recently modified it. This “direct to root cause” approach accelerates debugging by eliminating the need for trial and error and repeatedly restarting the program with different breakpoint locations. It reduces multiple debug iterations down to one debug cycle: from symptom back to root cause.
But time travel debugging is not just about stepping back a couple of hours in your program’s execution. When integrated into a test suite, it allows your whole team to step back in time to 2 weeks ago (or 2 years ago!) – when a process failed and was captured in a recording file (akin to video footage).
How the technology works
There are various ways to implement time travel debugging. Undo’s implementation exploits two key insights during recording and replay:
Insight 1 – In order to replay a non-deterministic program’s execution, we don’t need to record every CPU instruction. Instead we can record the sources of non-deterministic input, and replay be executing and inserting in the recorded data instead.
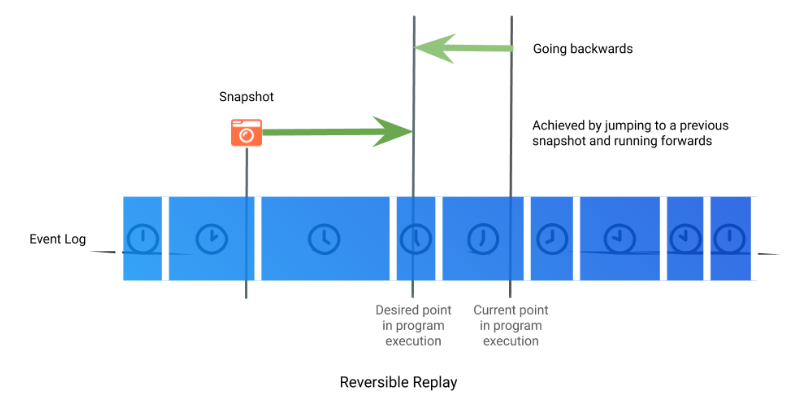
Insight 2 – Rather than running the program in reverse to revert the effects of an instruction, we can achieve the same effect by replaying the program from the start of the execution and stopping before the previous step.
Record
During recording, TTD uses a number of techniques to exploit insight 1 and capture all non-deterministic inputs to a program. There can be various sources to these inputs, which can be captured from intercepting system calls, re-writing CPU instructions, or can be due to instruction ordering, shared memory, or asynchronous I/O.
Intercepting system calls
TTD intercepts all system calls (i.e. calls to the kernel) and, before returning the results to the program, saves a copy of the data in an in-memory “event log”. TTD currently uses the UNIX ptrace facility to perform this interception, but other implementations are possible.
Re-writing CPU instructions
Some CPU instructions generate non-deterministic data., for example a hardware random number generator instruction. Since the program may make decisions based on the random number returned, TTD needs to ensure that the program sees the same number at replay-time that it saw at record-time. In order for it to receive the data obtained at record time during replay time, TTD achieves this by implementing a just-in-time (“JIT”) compiler. This JIT compiler examines the program code about to be executed and rewrites any CPU instructions that generate non-deterministic data to save a copy of that data to the in-memory event log. For efficiency purposes, TTD maintains an “instrumentation cache” of the re-written blocks of code within the program’s address space.
Instruction ordering
As far as a program is concerned, the kernel’s scheduling of threads and signal delivery are asynchronous non-deterministic inputs that interfere with the otherwise predictable ordering of instructions; so TTD needs to capture and record these too. TTD achieves this for signals by redirecting them to a trampoline that it inserts into the process’ address space. The trampoline records the kernel’s invocation of the signal handler as an event in the in-memory event log. For thread scheduling, TTD records a thread switch as an event in the in-memory event log, with sufficient information that the thread switch can be recreated at playback.
Shared memory
TTD observes when the program has memory regions shared with other processes, intercepts reads that the program makes from these regions and, in the case that the read values are different from what the program last observed, saves a copy of the data to the in-memory event log.
Asynchronous I/O
TTD intercepts synchronous I/O via the mechanism described above. To achieve the same effect for asynchronous I/O, TTD intercepts and records those asynchronous operations that are in-flight, and saves a copy of the data to the in-memory event log when the operation completes.
At pre-configured events, such as program termination, the in-memory event log containing the non-deterministic inputs is written to disk as a recording file. TTD also includes a library which the program can use to programmatically start and stop recording, and to save a recording file.
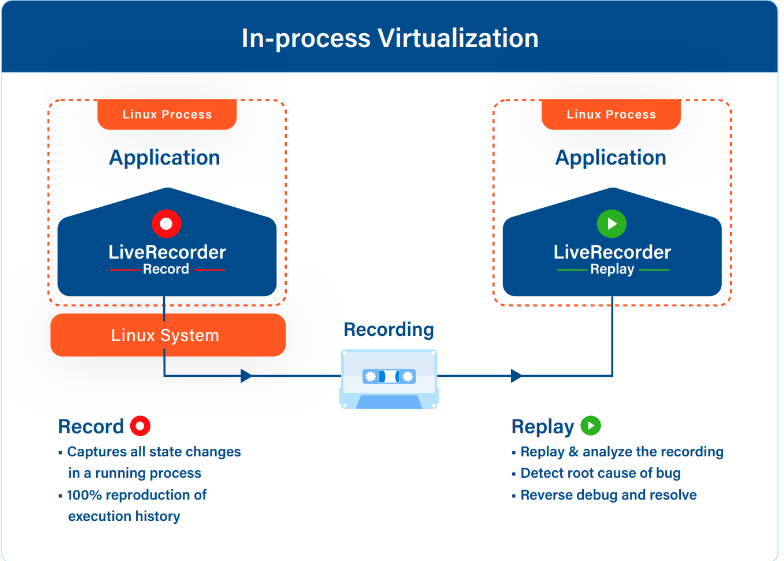
The techniques described above are a form of lightweight virtualization. But in contrast to conventional virtualization solutions, the virtualization operates:
- At the interface between the program and the system software rather than at the interface between the system software and the hardware, and
- Within the program’s address space rather than external to the system.
For this reason, the Undo engine for TTD is best thought of as an in-process virtualization engine.
Replay
During replay, the program’s execution can be reproduced by re-executing it, and inserting the previously recorded data at the appropriate place and time.
For example, if the program calls the kernel’s read system, then a copy of the data in the in-memory event log will be saved before the results are returned to the program. This data is then saved in the recording file.
When replaying, the read system call will be short-circuited. The data from the recording file is inserted at the appropriate place in the program’s address space, and the CPU registers are adjusted as if the system call had happened before returning to the program. In order to support reversible debugging within various environments, TDD exploits insight 2. To do this quickly, various snapshots of the program’s entire state are maintained dynamically, scattered throughout the program’s execution. which the engine can use as previous points to start rerunning from.
Types of bugs that time travel debugging can help you resolve in an afternoon
Time travel debugging is really powerful for:
- Any bug where time passes between the bug occurring and the symptoms presenting themselves, i.e. assertion failures, segmentation faults, or simply bad results being produced.
- Any bug which occurs intermittently or sporadically – for example, a bug that occurs one time in a thousand, or occurs in a different way on each run of the program. Bugs tend to manifest in this way when the program’s execution is non-deterministic due to multithreading and/or interaction with other processes and services.
Most race conditions fall under one or both of these cases; so do many memory or state corruption bugs and non-trivial memory leaks.
Specialized tools (e.g. ThreadSanitizer, Valgrind, etc.) can help with some of these issues, and you should strongly consider using them routinely if you’re not already doing so. But you probably wouldn’t be reading this paper if they had solved all of your problems.
The following are some common scenarios that TTD can help you resolve more quickly and more efficiently than other debugging methods.
Race conditions
Take a bug where code in one thread accesses shared data but claims the wrong lock. This shows up as a threading bug where two threads are accessing data A, but one of them has locked data B by mistake, causing a race condition between the threads. Using a conventional debugger, the bug will show up as a corruption of data A, but the cause won’t be at all obvious.
Typically, the response is to run again with watchpoints set, but this can result in a lot of false positives unless a complex condition is defined to filter out the OK accesses; and having set all that up there’s a strong chance that the bug won’t manifest next time. Time travel debugging makes it faster: by starting at the end where the corruption is detected, setting a watchpoint and running backward, the source of the corruption can be found much sooner.
Memory corruption
Corruption of a linked list leads to a crash, but it is difficult to see when the corruption occurs. Rather than having to continually rerun the program, time travel debugging allows developers to go back in time to before the list was corrupted and use a binary search to quickly find out exactly when the corruption occurred. This can bring debugging time down from hours to minutes. Read this routing engineer’s story on how he fixed a memory corruption issue in under 10 minutes with time travel debugging.
Core dump / segmentation faults are all too common. They can occur when a program is attempting to read or write to an illegal memory location.
Using old debugging methods, a starting point would be to use a debugger to view a backtrace of a core file. Doing this would let you know roughly where the program was when it crashed. This information would reveal where to start when trying to investigate the cause of the crash, using an iterative process of elimination. By contrast, time travel debugging enables developers to zero in on the root cause of the bug in a systematic way without needing to guess and restart the program several times.
Stack corruption
Buffer overruns and other kinds of defects can corrupt the stack. This decreases the amount of useful information that a backtrace or a conventional debugger is able to extract from a core dump. Using time travel debugging, developers can rewind to see the stack corruption and fix the issue in minutes.
Memory leaks
Obscure memory leaks can cause software to run slower over time and potentially even crash. Memory leaks are hard to debug using conventional tools because there is a large gap in time between the allocation of a buffer and the point where it should be freed. It’s also not clear where the fault is – the problem is likely to be an absence of code where it should be. Worse, if the program is rerun, it may be a different buffer that leaks. A time travel debugger gives developers the chance to work on a single example failure, moving freely backward and forward through the execution history to identify where the missing code should be
Long run times
Sometimes tracking down a bug can itself be an O(n2) iteration: running the debugger for 5 minutes until the bug manifests itself, setting a breakpoint earlier in the code and running again for 4 minutes, setting an earlier breakpoint and rerunning, etc. With time travel debugging, that time-consuming run-restart cycle can be reduced to an O(n) process. Run until you hit the bug, then step backward to see what led to the problem. Did you miss it? Step forward a little, and backward again.
Frequently called functions
Take the example of a function which is called many times, but fails after about a thousand calls due to a segmentation / access violation fault. Setting a breakpoint in the function doesn’t work well because it stops at the first occurrence, when really you want it to stop at the last one – but that involves predicting the future! With a time travel debugger, it’s possible to run to the end and only then set a breakpoint. When running in reverse, the first breakpoint you hit is the last time that code was executed.
Dynamic code
Some applications generate specialized code at runtime. Debugging this code is hard for several reasons. The generated code may have no corresponding source code for analysis tools to work with and could be generated at different addresses on different runs. A time travel debugger allows developers to capture and examine a single run in detail, without the headaches associated with rerunning.
These are just some of the many situations where time travel debugging can save developers a considerable amount of time when debugging
The key benefits of using time travel debugging
Debug the most complex of systems
Where other methods of error detection and debugging can provide indications of what went wrong, TTD helps developers skip past the need to reproduce bugs, so they can just focus on identifying the root cause. Compared to logging in particular, TTD gives the full picture of execution history over time (rather than a snapshot moment) exactly as it happened.
TTD gives developers complete control of the program’s environment and execution, also providing additional benefits due to this control:
- Undo can expose and record latent concurrency defects – This comes from its support for Thread Fuzzing, due to its control over the scheduling of program threads.
- Undo can debug defects in multi-process applications – It supports access to shared memory, which can be used to track and correlate interactions between processes that communicate via data structures in shared memory.
Boost developer productivity
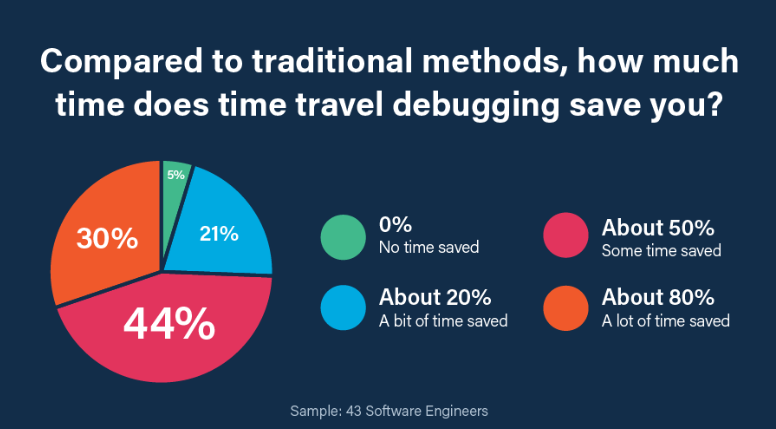
Most time travel debugging users report they are able to cut their debugging time by 50 – 80% compared to using traditional debugging techniques and tools.
That’s because:
- A recording provides you with an “atomic environment” where program behavior remains the same anytime, anywhere, and for anyone. No more “works on my machine”. You now have the reproducer which you can replay as much as you need. One developer said “When I’ve got a recording, I can tell my boss the bug will be fixed today.”
- It fast-tracks developers straight to the exact root cause without wasting time trying to reproduce the error
- It reduces the number of debugging iterations down to a single loop
Increased observability and understandability
Being able to time travel and replay code execution history allows developers to observe, comprehend, and learn runtime behavior of legacy code or code they did not write themselves. This is essential for modern development teams to greatly improve productivity across both debugging and maintaining code quality.
More information about Undo
Undo makes bugs 100% reproducible with time travel debugging.
Undo lets developers start debugging test failures instantly. Undo provides a one-click workflow from a test failure to a time travel debugger placed exactly at the point of failure – skipping the tedious steps usually required to reproduce the problem.
Developers working on complex C/C++, Go, and Java software can now save a huge amount of time diagnosing the root causes of new regressions, legacy bugs, and flaky tests. Bugs that took days or weeks to isolate can now be resolved in hours.
Three-step method:
- Record CI / System Test failures to capture the execution of failing test runs, including intermittent failures; store the recordings for later analysis and cross-team collaboration.
- Replay recordings: jump from the test failure (or bug report) straight into a ready-to-go, fully set up, debug session in your web browser.
- Resolve bugs fast by tracing from symptom to root cause in one cycle: go back to any point in the execution history to inspect application state (including contents of all the variables and the heap) and see exactly what your software did.
Undo boosts developer productivity
Undo fits in your existing development workflow – no software to install and no set-up required.
And once inside a recording in your VS Code interface (or in the command line), Undo incorporates the full functionality expected of modern debuggers (such as scripting, conditional breakpoints and watchpoints, full inspection of globals and locals).
It also allows these features to be used with the program running in reverse or forward.