WatchPoint

Using Helgrind to debug data races
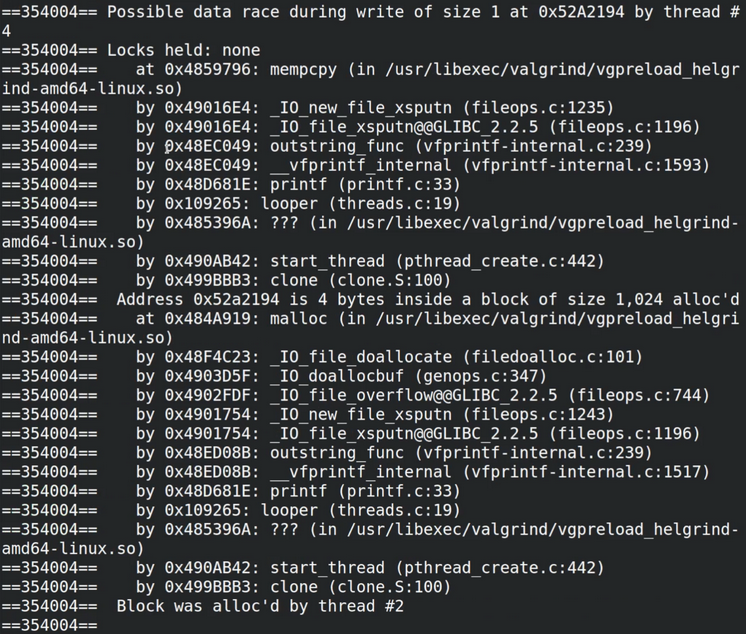
A data race is when multiple threads in a process each access the same piece of state, leading to the program’s behavior changing based on which thread accesses that state first. These data races can be detected with tools like ThreadSanitizer (view my tutorial on TSan) or with Helgrind, a thread error detector. Here’s an example C program from the ThreadSanitizer wiki which includes a data race: The main and child threads both update the In order to run Helgrind on our program, the program must first be compiled normally. Helgrind is then ran on the executable like so: Helgrind has picked up on the fact that two threads in the program are attempting to write to the same variable without any synchronization. It shows the location of these attempts in the source code (lines 9 and 19), as well as the name of the variable (Global). This program displays 4 quasi-random changing characters, with a thread responsible for each character in the string. When running this program through Helgrind, it runs one thread at a time. Whilst this will slow down your program, it can still diagnose race conditions as the scheduling is preemptive. As you can see, Helgrind once again detects possible race conditions on line 19 where printf accesses the character array. Helgrind has a few command-line options that are set as flags during execution: When enabled, Helgrind treats freeing of memory on the heap as if it were a write. This helps avoid a race condition where one thread tries to free the memory before a different thread tries to reference it. When enabled, Helgrind performs lock order consistency checking. Helgrind is more than just a data race detection tool and this check ensures that locks are released in the correct order. In particular, it will find potential deadlocks due to multiple locks being taken sometimes with different ordering. This option changes the amount of information Helgrind attempts to collect from thread accesses. “Full” collects enough information to produce two stack traces in a race report, “none” collects no information about previous accesses and “approx” is a compromise between these two. The more information Helgrind collects the more expensive the tool is in both speed and memory. Data races and other race conditions can be very difficult to find and often make their way through testing and into production code. Tools like Helgrind and ThreadSanitizer make it much easier to locate the root cause of these issues. Overall, Helgrind and ThreadSanitizer perform very similar jobs with slightly different use cases. ThreadSanitizer runs the program faster at the expense of requiring your program to be recompiled, whereas Helgrind runs the program slower but can be run on already compiled binaries. Debugging Basic Data Races with Helgrind
#include <pthread.h>
#include <stdlib.h>
#include <unistd.h>

int Global;

void*
Thread1(void *x) {
	Global = 42;
	return x;
}

int
main(void) {
	pthread_t t;
	pthread_create(&t, NULL, Thread1, NULL);
	for(int i = 0; i < 10000000 ; i++)
		;
	Global = 43;
	pthread_join(t, NULL);
	return Global == 42 ? EXIT_SUCCESS : EXIT_FAILURE;
}
Global variable concurrently, and the value of the variable when checked at the end of the main function is determined by whatever thread “lost” the race and therefore wrote to the variable last. In this example the loser is typically the child thread, however occasionally the main thread will lose the race instead.gcc -lpthread race.cvalgrind --tool=helgrind ./a.out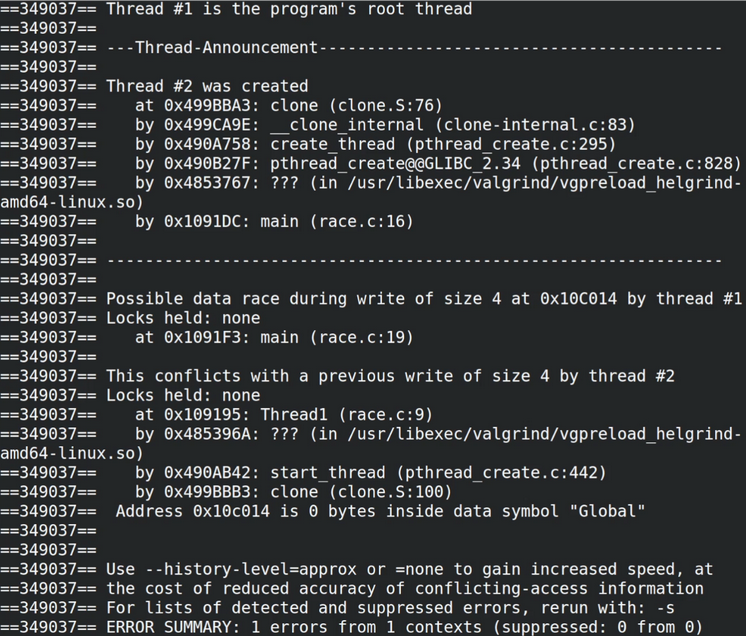
A further example
#include <assert.h>
#include <pthread.h>
#include <stdio.h>
#include <stdint.h>
#include <unistd.h>

char spinners[] = "aaaa";

static void *
looper(void *p)
{
	int idx = (intptr_t) p;
	while (1)
	{
		spinners[idx]++;
		if (spinners[idx] > 'z') spinners[idx] = 'a';


		printf("%s\r", spinners);
		fflush(stdout);
	}
}

int
main(void)
{
	int thread_count = 4;
	pthread_t threads[thread_count];
	for (intptr_t i = 0; i < thread_count; i++)
	{
		int e = pthread_create(&threads[0], NULL, looper, (void*)i);
		assert(!e);
	}

	for (int i = 0; i < thread_count; i++)
	{
		int e = pthread_join(threads[0], NULL);
		assert(!e);
	}
}
Helgrind options
--free-is-write=no|yes [default: no]--track-lockorders=no|yes [default: yes]--history-level=none|approx|full [default: full]Summary
Want debugging tips directly in your inbox?
Share this tutorial