Resources
How to Debug SystemC with Time Travel Debugging
Author: Jonathan Bonsor-Matthews held software and silicon engineering and leadership positions at Broadcom, AMD and Argon Design, and founded LightBlue Logic.
Using Undo Time Travel Debugging with SystemC
In my experience, time travel debugging allows SystemC designs to be debugged several times faster than traditional techniques. This is important because SystemC designs can be large and complicated. Many modules run at the same time, with data being accessed from many places concurrently. The scope for logic errors, race conditions and other synchronization issues is huge. It can be a time-consuming challenge finding bugs in such designs.
With time travel debugging, we can work backward from a known point of failure to find the source of a bug significantly more quickly and without having to understand all the code along the way. This article demonstrates the power of time travel debugging techniques by, firstly, considering a simple example to set the scene and, then, showing how a challenging logic bug hidden in a large, concurrent design can be easily unearthed.
For this article, the focus is on using Undo within Visual Studio Code. If you prefer the command line, the same techniques will work just as well there.
Enjoy!
Tutorial: Follow Along
- Get hold of Visual Studio Code
- Install Undo’s extension:
- Bring up the Extensions view by clicking on the Extensions icon in the Activity Bar on the left hand side of the window
- Type undo.udb into the search box
- Press Install
We’ll be using Accellera SystemC Class Library’s example code to provide these examples. You should download it; make sure you’re at the same commit as here and build it without optimizations as follows:
# Get the code
git clone https://github.com/accellera-official/systemc.git
# Find the same commit
cd systemc
git checkout 43310a792672011757e1da99316f45b4686e3137

# Build without optimizations
./config/bootstrap
mkdir objdir
cd objdir
../configure --enable-debug --disable-optimize
make -j

# Check the examples work out of the box
make -j check
A couple of notes:
- you may need to install automake and libtool for the bootstrap to work, eg:
-
sudo apt install automake libtool
-
- you don’t need to disable the optimizations as shown above, but it makes the debug experience much better if you can
A Simple Example
Let’s start with a simple example to get to grips with how to use Undo to debug our SystemC designs. I’ve introduced a bug in one of the examples, in simple_fifo.cpp – let’s debug it!
We start by building the examples (adding a bug in the patch) – from the root of your SystemC checkout:
patch -p1 < simple_fifo.patch
cd objdir
make -j check
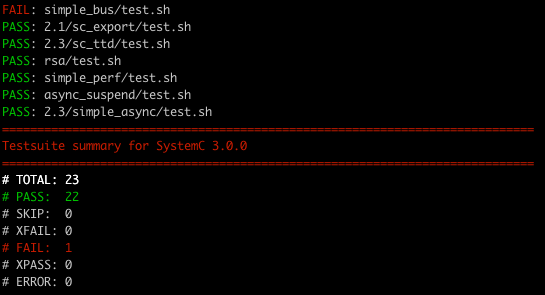
and observe that simple_fifo/test.sh has failed:
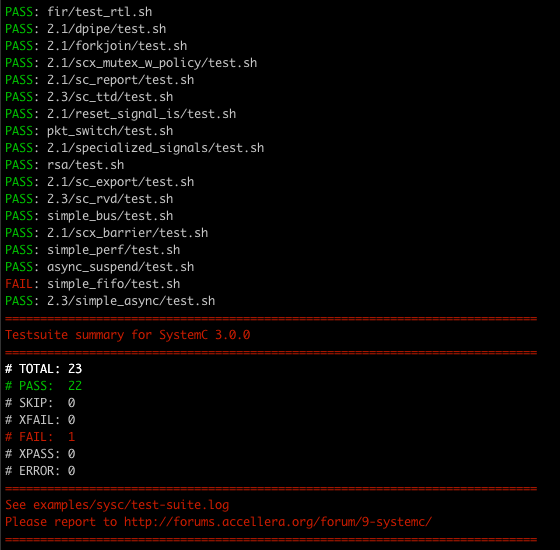
The test framework in use here is typical of an auto-generated wrapper-based system we might see in an established codebase. It makes connecting a debugger seem tricky, but actually it’s quite easy. Let’s fire up Visual Studio Code and open that script:
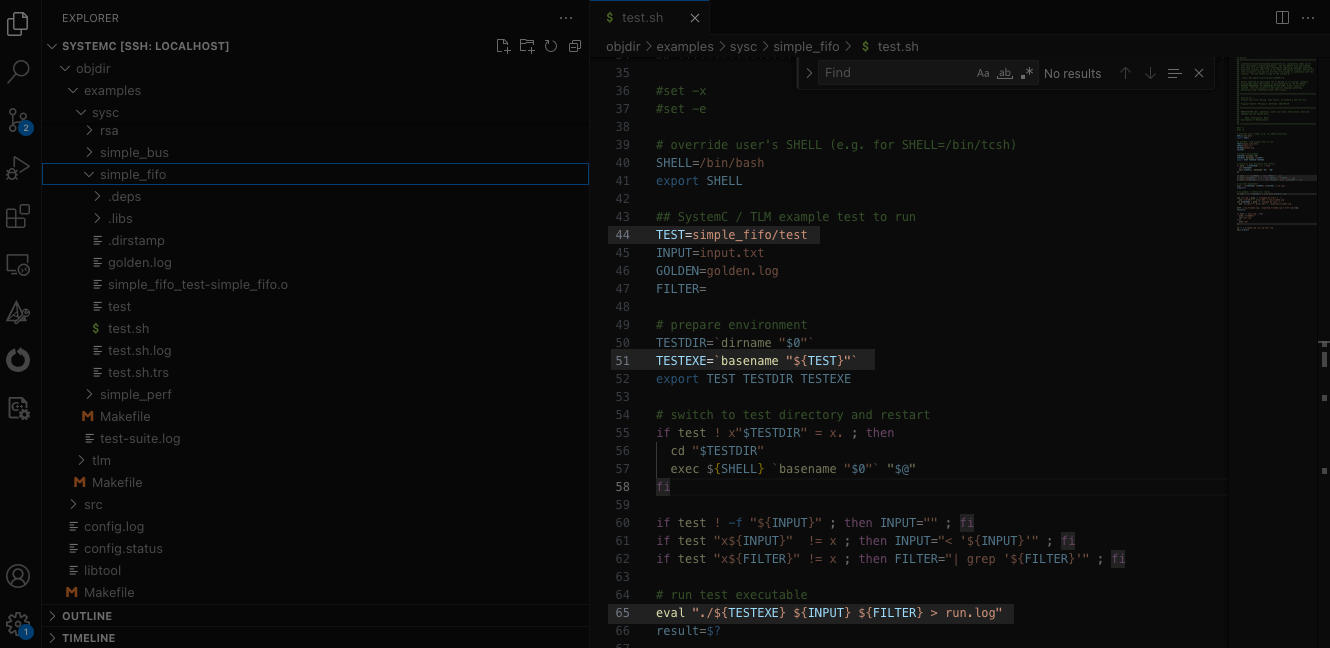
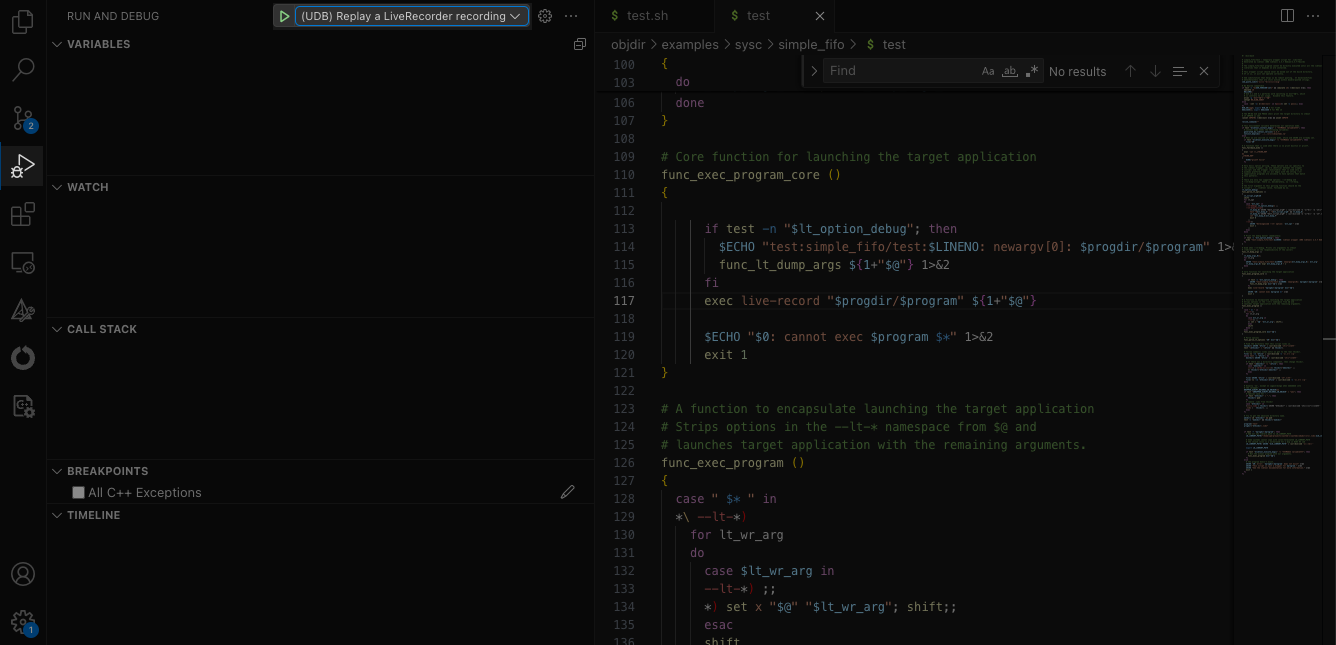
Observe that it’s running (via eval on line 65) simple_fifo/test, let’s look there:
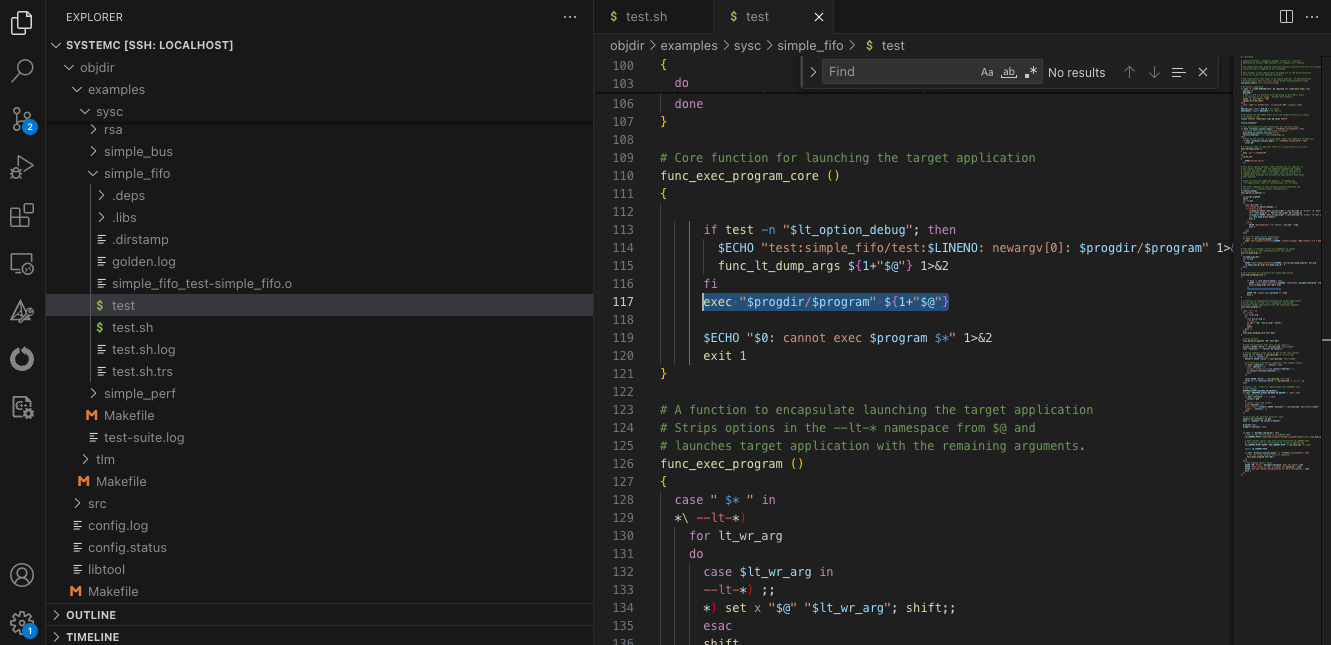
We can see that as well as a lot of setup, the actual executable is run on line 117: exec "$progdir/$program" ${1+"$@"}. The setup makes it challenging to run this directly with UDB, but fear not, we can use live-recorder directly.
Run the test again using live-recorder:
live-record --record-on program:test ./examples/sysc/simple_fifo/test
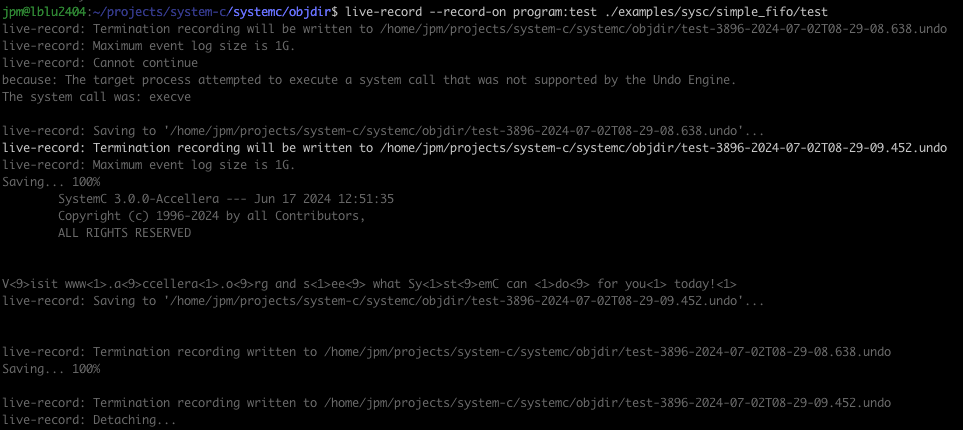
This command will record any program.
Here, we note two useful things:
- The location of the recording: the file ending
.undo. In fact there are two Undo recordings, one for each executable in the process tree that matches the nametest. Hence here we have two: there is an outer shell script and the inner test binary, so there will be two recordings generated. - The signature of the failure: it looks like the output message is somehow shifted from what we expect.
Back to Visual Studio Code and let’s get UDB attached to the recording. Click the Run and Debug icon, select “(UDB) Replay a LiveRecorder recording” from the drop-down and hit the green play triangle, then enter the recording filename from above and hit ok:
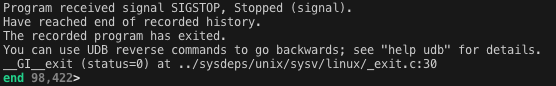
We note from the “TERMINAL” view that the program has finished successfully:
This suggests that the output checking occurs externally to the executable itself, so let’s load the code (examples/sysc/simple_fifo/simple_fifo.cpp) and observe from where the output from this program comes. We find it’s the consumer’s main() function, so let’s set a breakpoint by clicking to the left of line 132 to add the red circle (can also be seen in the list of “BREAKPOINTS”):
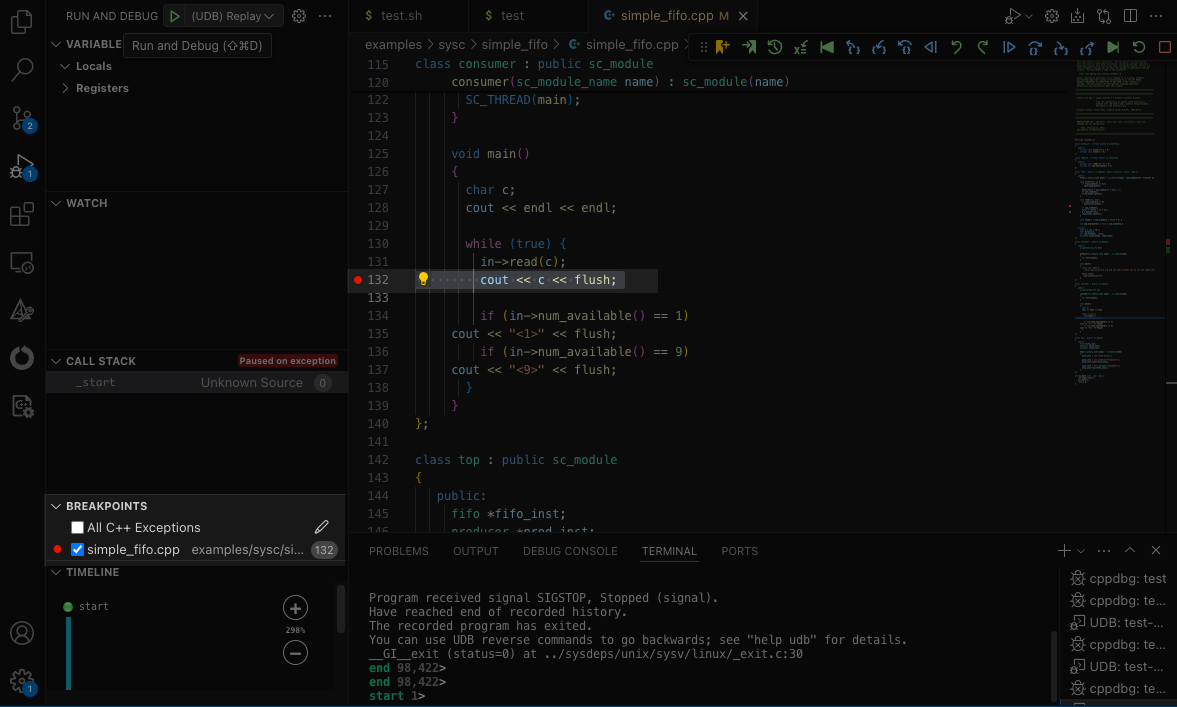
Then click the green rewind-to-start button followed by the blue forward play button, to get to the first instance of this firing:
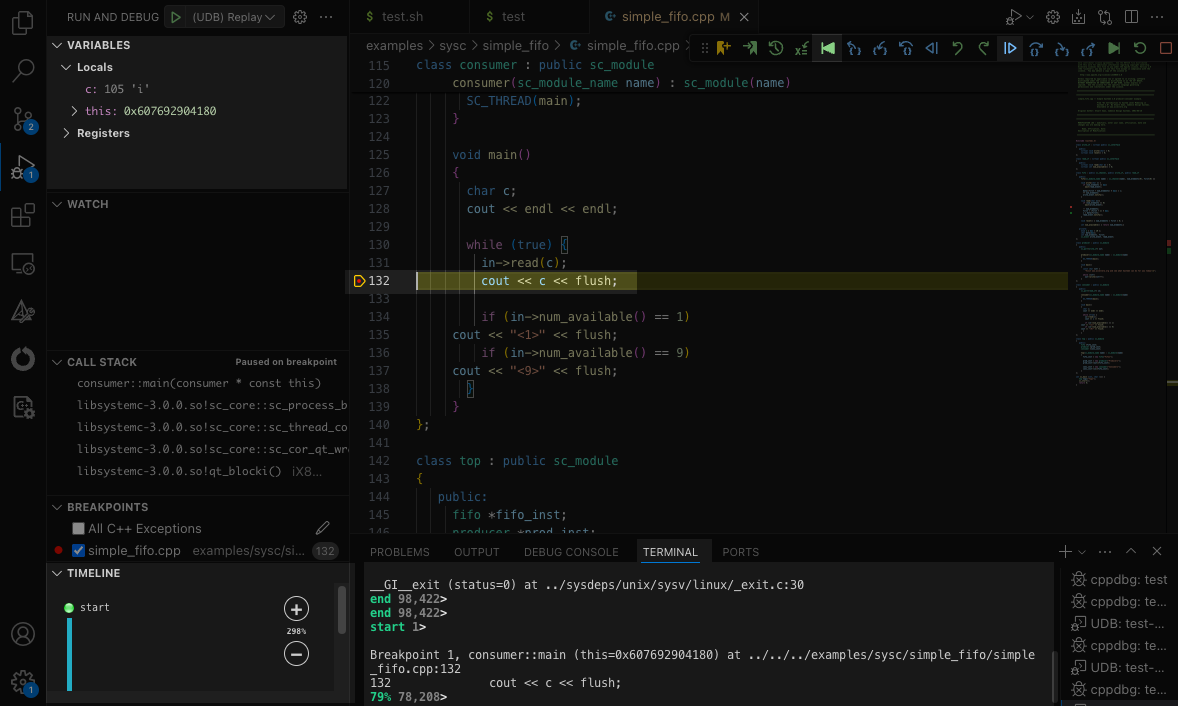
We’ve stopped where we wanted, noting:
- The “TIMELINE” now shows we’re very near the start
- The orange triangle around the breakpoint on line 131 showing where we are
- The “TERMINAL” output confirming the above in text
- The “VARIABLES” -> “Locals” showing the value of
cis‘i’– the erroneous first outputted character we saw before
How did that ‘i’ get there? Let’s click the blue reverse-step into button:
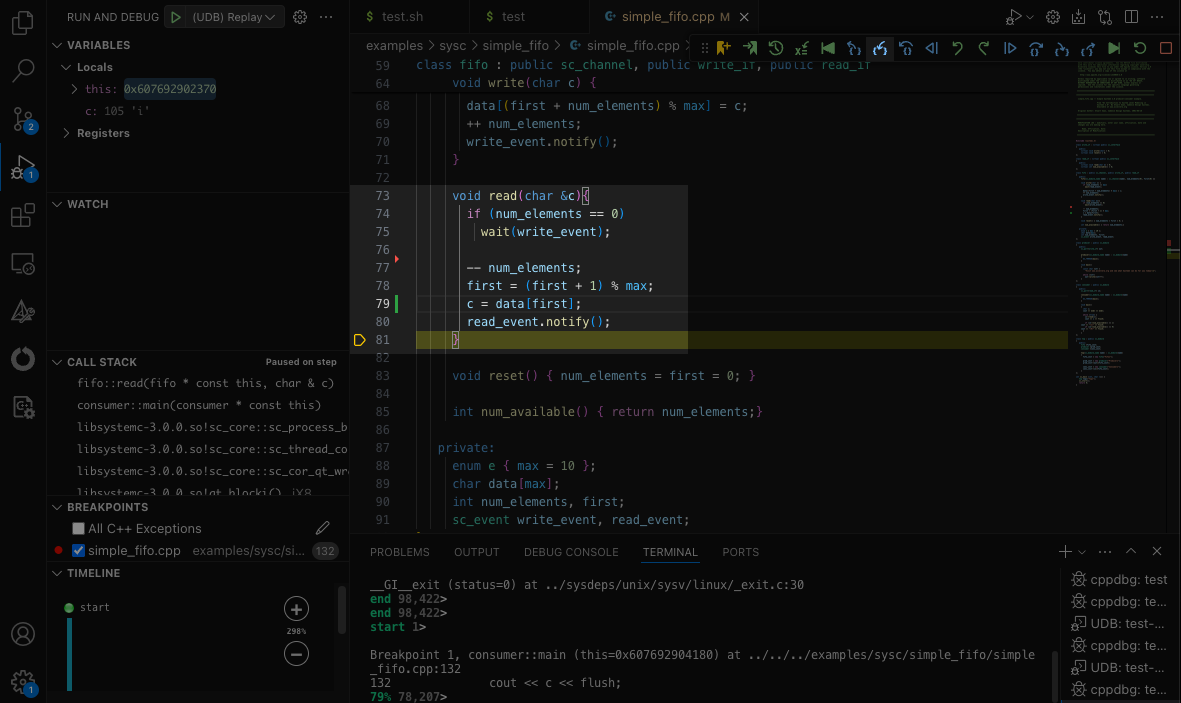
This is like the ‘step’ operation, except we go backward. That is, we step back into the callee function’s return statement. We have entered the read function and see the value of c being filled on line 79: c = data[first];
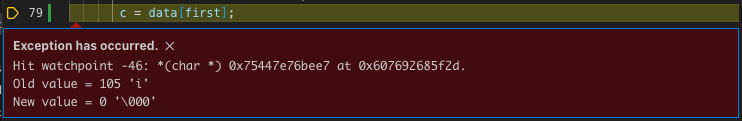
nb We could also have reached this by a more powerful route: clicking the green “Last changed” button, and typing the expression “c”, giving the following view:
first is a global variable, so doesn’t appear in the “VARIABLES” pane. However, if we hover our mouse cursor over it, we see the value is 1 (we could also type p first in the “TERMINAL” pane).
Hang on! The first time we write to an array, should we write with an index of 1? Shouldn’t that be 0? Sure enough, if we look up to the write() function, the first write occurs with index 0. Line 79 is in the wrong place; the write to data should be before the wrapped increment to first on line 78 – that’s our bug found! The fix is trivial: just swap lines 78 and 79.
Ok, this was a very simple example, but it shows how easy it is to start time travel debugging with SystemC and how convenient it is to step backward afterwards to discover what we want to know!
(nb To leave the debugging mode, click the empty red square in the debugging icon pane.)
An Aside About the “CALL STACK”
If you are familiar with debugging, you might have come across the concept of the call stack. This is the route through which the execution has reached its current point – that is, the history of the function calls leading to where we are now.
In SystemC, the call stack can be a little confusing:
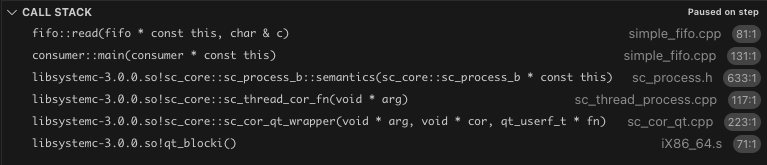
In the simple example above, the top-most two calls are what we expect:
- consumer’s
main()function - the attached fifo’s
read()function
Underneath gives an insight into the way the SystemC kernel’s scheduler executes each sc_module. It’s not for the faint-hearted! Broadly, the implementation is very low-level and manually saves, updates and restores the current process’s registers and stack pointers. The debugger can only unwind the call stack to this point (in iX86_64.s here).
Knowing this is enough to know not to worry further than that. Set your breakpoints in the functions you care about and watchpoints on the data you want to track, and don’t worry about how the sc_core got you there.
Something a Bit More Challenging
Sometimes, when we’re debugging a large or a new codebase, we’re faced with lots of unfamiliar code. This can be daunting and often we don’t have time to study the entire codebase when we have to quickly solve an issue. (Or maybe we’re not even trying to root cause a bug and we just want to understand how all this code hangs together – i.e. we’re trying to figure out how does it work? not why is it broken?)
Here I’m going to show how we can get to the core of an issue quickly in very unfamiliar code.
This issue also simulates a very common example when working with SystemC – many sc_modules will simultaneously be accessing different data, queueing asynchronous requests and so on. When we find a data corruption, unravelling what is going on using printf style debugging can be a real challenge. With time travel debugging, we can go straight to where the “thing” went wrong.
Again, I’ve introduced a bug, so let’s apply the patch – again, from the root of your SystemC checkout:
patch -p1 < simple_bus.patch
cd objdir
make -j check
We can see that the simple_bus test now fails:
As before, let’s get a recording of that: live-record --record-on program:test ./examples/sysc/simple_bus/test and noting the correct .undo recording file.
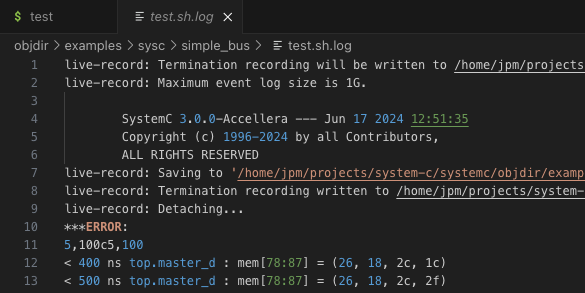
Let’s take a look at the failure signature in objdir/examples/sysc/simple_bus/test.sh.log noting that the first mismatch is at 400ns:

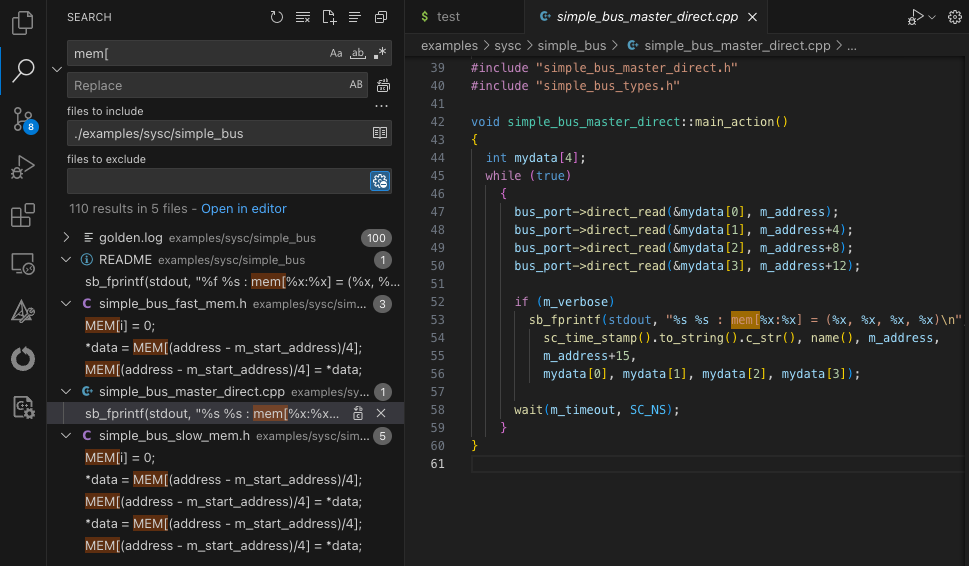
By searching the code, we can find the log text is outputted from examples/sysc/simple_bus/simple_bus_master_direct.cpp:
Click to add a breakpoint there (line 53), go to the “Run and Debug” side pane, start debugging the recording we just saved, click the blue “Reverse Continue” button to allow us to examine the context there. (nb VSCode has put us at the end of time. If we were running in the Command Line Interface (CLI), then we’d be at the start of time and would have to work forward to debug this.)
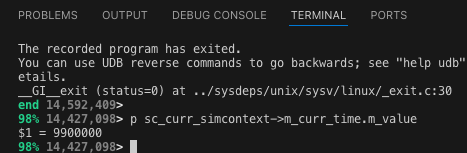
We want to go back to the point when the output first differs (400ns). It’s not trivial to set a condition as the code is currently formulated. Let’s right-click sc_time_stamp() and “Go to Definition” – if you continue exploring the code down this route, you will find that we can express the timestamp as sc_curr_simcontext->m_curr_time.m_value. We can check in the “TERMINAL” window we have access to this:
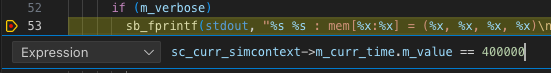
Note that this simulation time is expressed in picoseconds. Right-click on the breakpoint on line 53 of simple_bus_master.cpp and enter the expression to stop at 400ns: sc_curr_simcontext->m_curr_time.m_value == 400000:
Hit enter, then click the blue “Reverse Continue” button and we start to get a lot of useful debug:
- Note the “TIMELINE” is now near the beginning of execution as expected given the length of this test
- In the “VARIABLES” click the arrow to the left of
mydatato expand it - Click the binary file icon to the right of
mydatato get a hexadecimal view (you might need to install the extension – Visual Studio Code will prompt you)
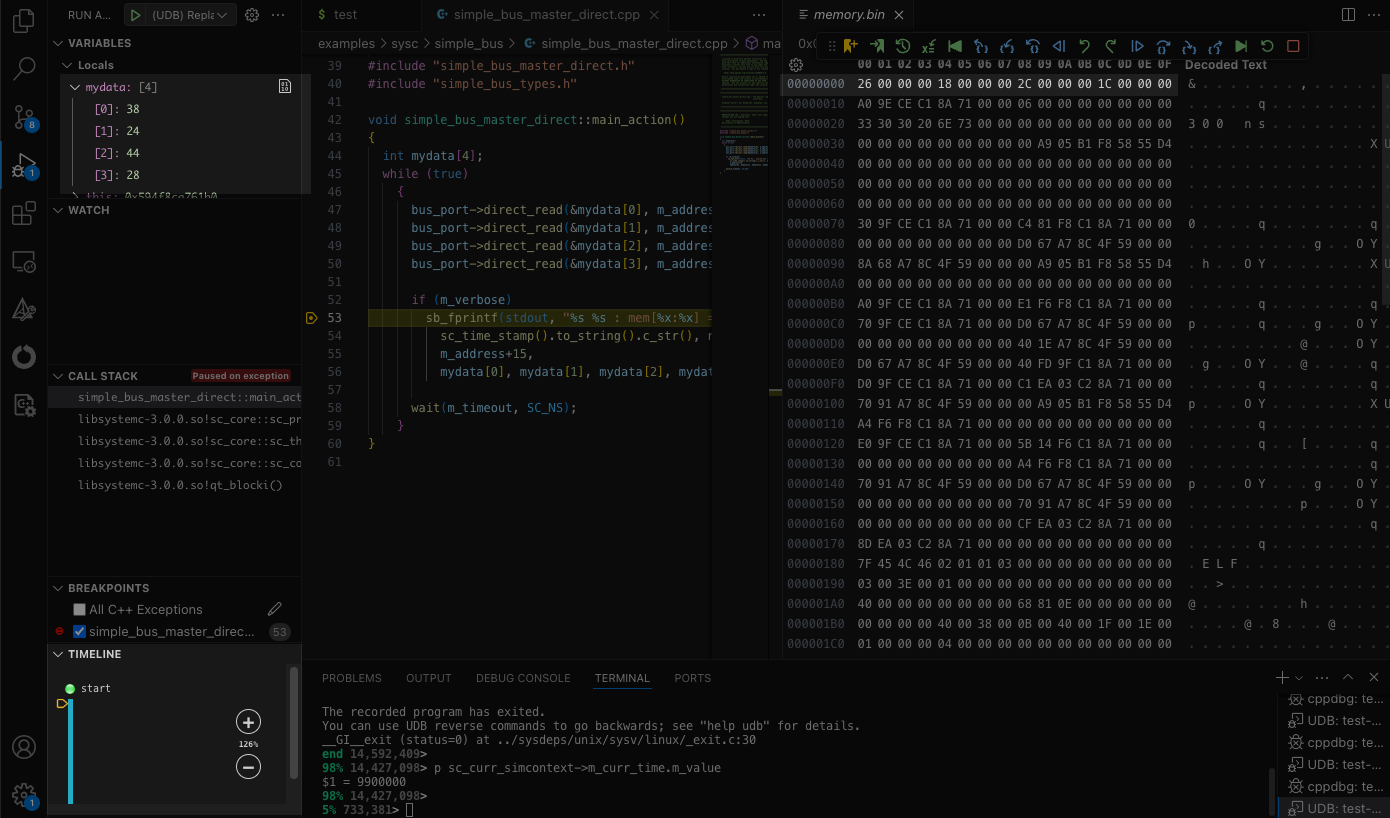
Observe mydata matches the incorrect values we spotted in the log – 26 00 00 00, 18 00 00 00, 2C 00 00 00, 1C 00 00 00 (hex for 38, 24, 44, 28). Let’s find out where they came from, by finding when they last changed – click the green “Last Changed” button and enter mydata[0]:
We now have two options for debug: is the data in MEM[] incorrect or the addressing? We can guess which is the most likely and note the fork in our debugging process to return later if we hit a dead-end. Here, let’s start with the data corruption (it’s a guess).
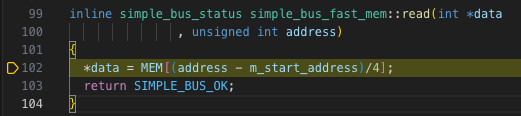
As well as using the GUI, we can enter standard GDB and UDB commands in the “TERMINAL”. Let’s see where the MEM[] was last changed by entering: last MEM[(address - m_start_address)/4]:
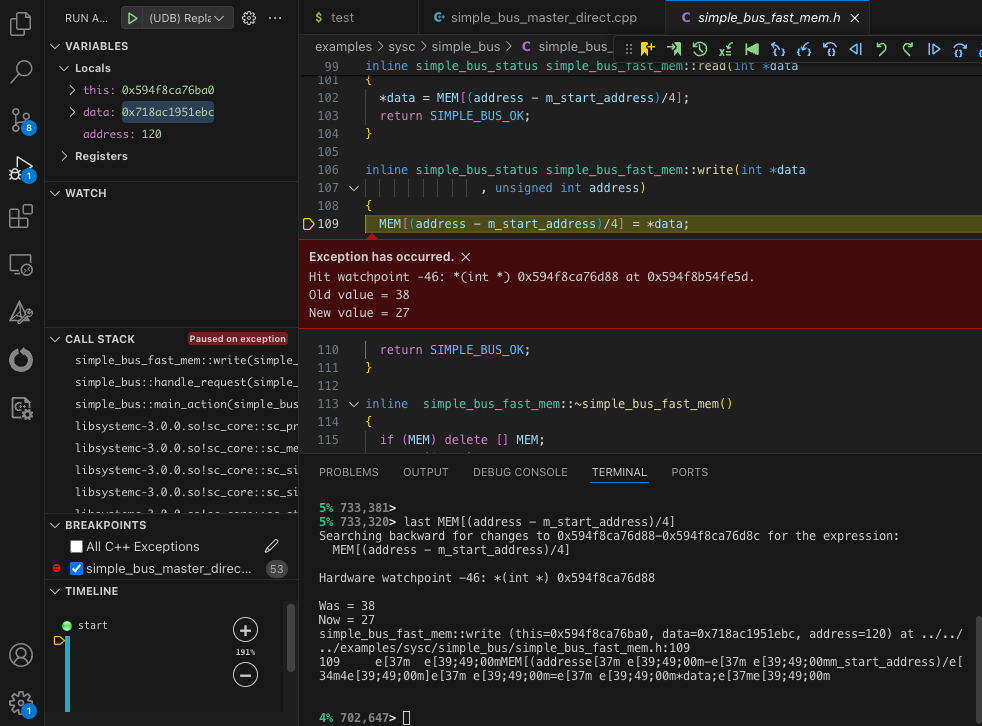
If we go one step up the call stack we can see that *data here is the data passed in through the request:
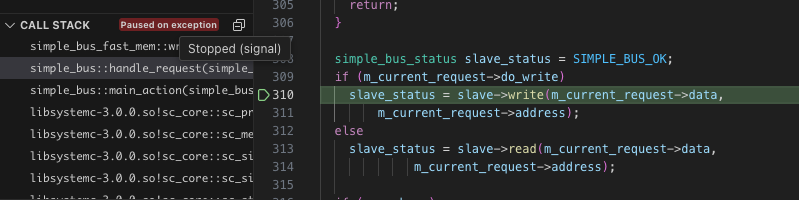
Let’s again find out where that changed, by entering last *m_current_request->data in the “TERMINAL”:
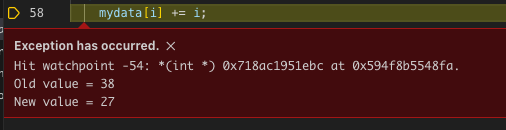
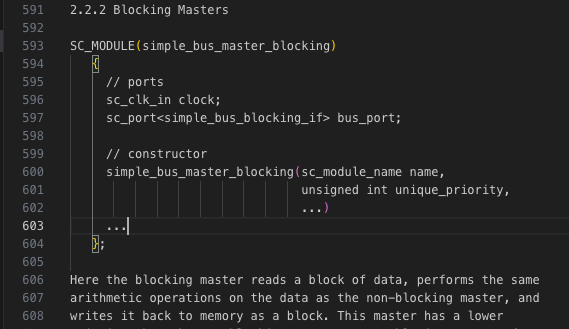
We can click the “X” to close the red watchpoint window to observe the code. We’re at the point where this data was originally set up. So now, finally, we are required to understand what the code was trying to do. Fortunately, this test is well documented, let’s look at the README:
Let’s compare then with the non-blocking master code, the key part being lines 48-64 of simple_bus_master_non_blocking.cpp (excusing the whitespace formatting!):
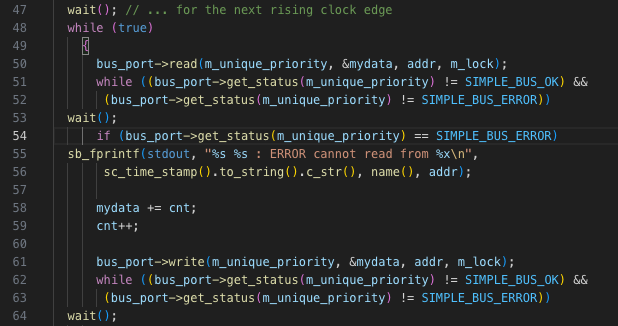
We can see that this code loops round:
- Making a
read()– on line 50 wait()– eg for a clock edge – on line 53- Modyifing the data (
mydatahere) – on line 58 - Making a
write()– on line 61 wait()– eg for a clock edge – on line 64
If we look again at the blocking code:
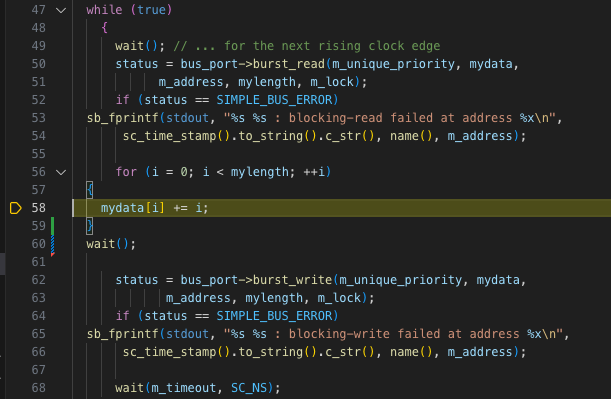
We can see that here we are queuing a burst read, which expects to get the data back sequentially each clock cycle. However, we modify mydata before all the data has been read. There are two obvious fixes here:
- Issue
wait() mylengthtimes prior to modifyingmydata. - Issue
wait()within theforloop (as the original code does). This approach makes the parallelism clearer to a reader and a SystemC compiler, that is that the data can be modified in a pipelined fashion.
We found our bug very quickly and it would have taken ages using printf techniques! We didn’t focus on understanding the code along the way, until we needed to. We didn’t need to worry about which different sc_module instances were being scheduled and when. We left the power of time travel debugging to help us swiftly get to the answer.
Want to try this on your own SystemC application? Grab a free trial and have a play.
Tips For Effective SystemC Debugging
Below is a small collection of tips to make time travel debugging of a SystemC design even more efficient:
- Set up the test framework or the regression system to automatically re-run any failures with
live-record, using the–-retry-foroption to allow retries and a timeout. This way when a failure is found, the recording is already ready to debug – this is particularly useful if the test takes a long time to run, the build system is slow or the wrappers make an individual run complicated. (nb If for whatever reason the tests are non-deterministic, it might be necessary to record all tests pass and failing, to catch a failure with a recording.) - Consider design-for-debug:
- Make the executable do the output checking if possible, enabling watchpoints to be set on failing data immediately, rather than finding the correct
printfor similar output point. - Consider intermediate variables to add setting conditional breakpoints. With the timestamp example above, we had to do some exploratory work to find the right variable for the condition. It would have been faster and even easier if, at the time of development, we had predicted we may use that variable as a debug hint later and put it in an intermediate variable.
- Make the executable do the output checking if possible, enabling watchpoints to be set on failing data immediately, rather than finding the correct
Do you have any more tips? If so, please send in your suggestions for easier debugging of SystemC with Undo and we can add them here to share with the wider community!