Built for Linux C/C++ developers
Root cause your hardest bugs in hours, not weeks
Time travel debugging for millions of line of code
Resolve customer issues within 24 – 48 hours by quickly getting a reproducer
Save time on diagnosing concurrency bugs caused by multithreading
Troubleshoot frustrating flaky tests producing inconsistent results
What is Time Travel Debugging?
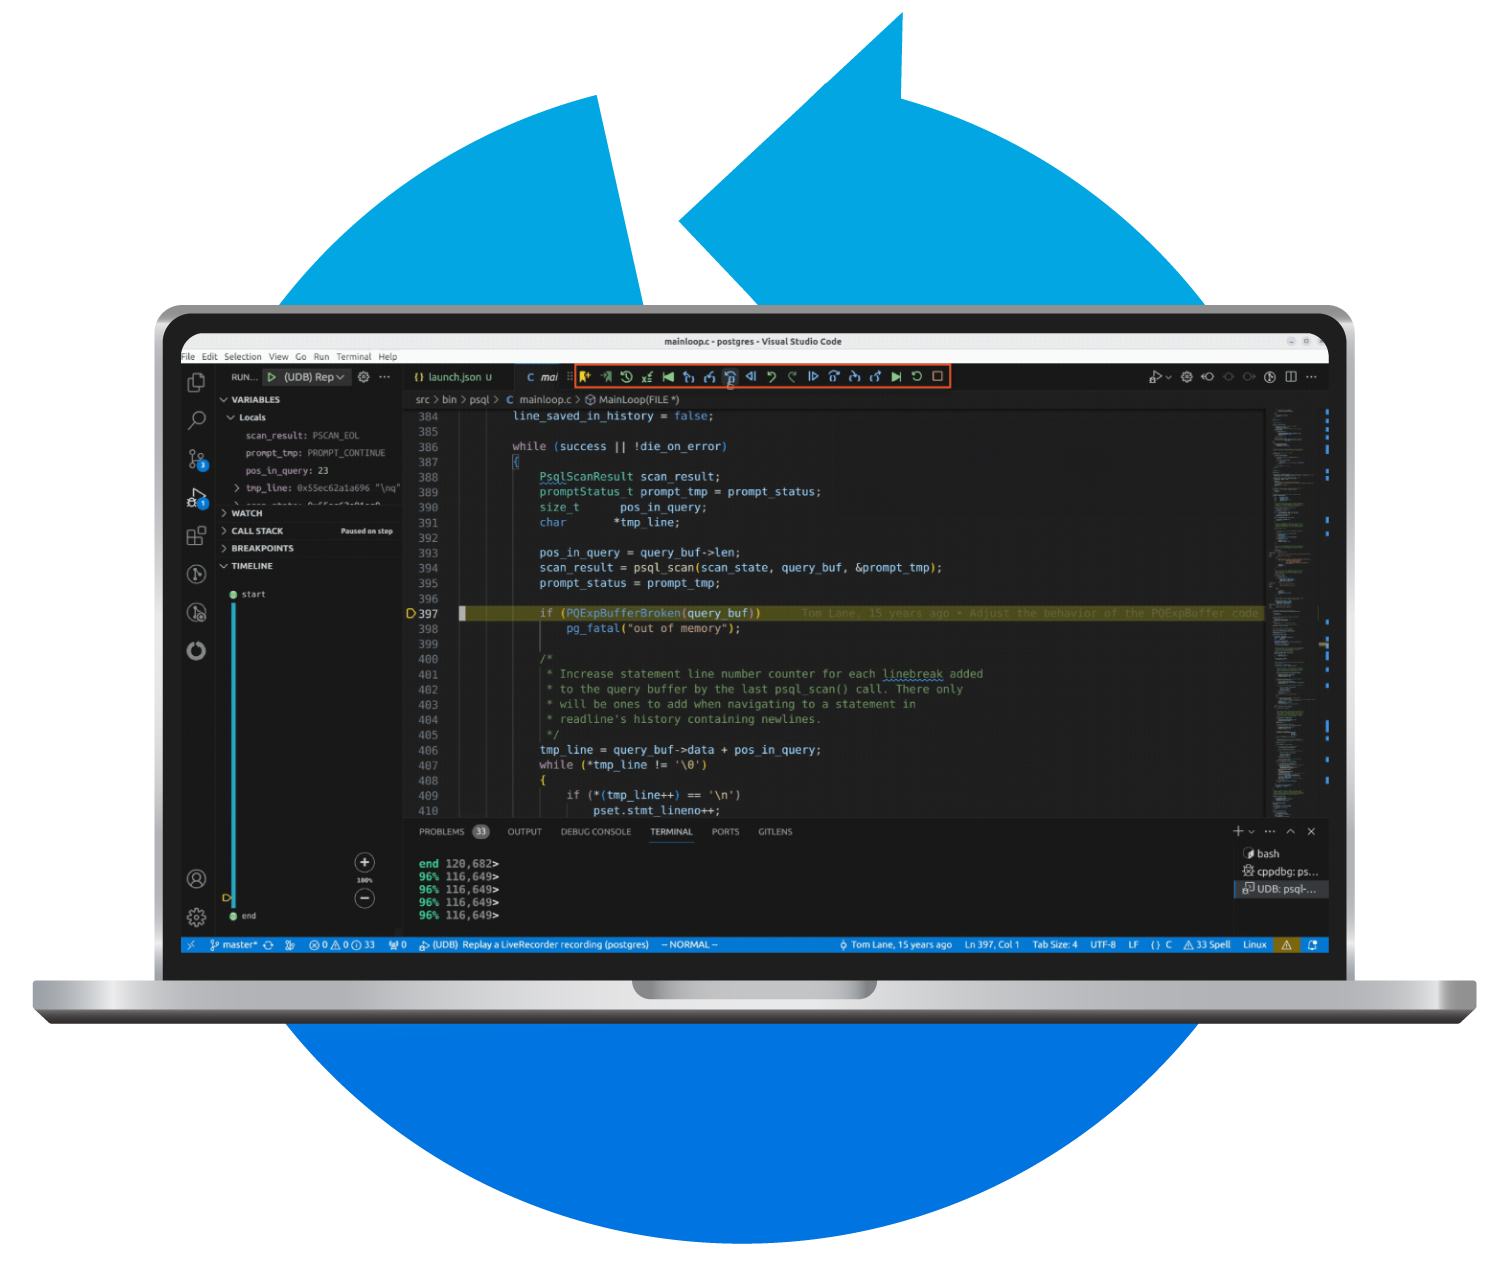
Record a process. Replay the recording. Step back in the
execution history to see what happened.
How Does it Work?
Capture a snapshot of the entire system state and examine the state of the program at any point in time.
Record
Replay
Resolve
Solve your Hardest Bugs – Fast
- Save time diagnosing the root causes of new regressions, flaky tests, and customer-reported issues – cut debugging time by 50 – 80%.
- Diagnose even the hardest of bugs, including memory corruptions and race conditions.
- Travel forward and backward in time to inspect program state – get to any point in the program’s execution history to see what happened.
Watch the Demo

Understand Code You Didn’t Write
Unfamiliar with the codebase? No problem! You don’t have to have it all in your head. All you need is a recording.
The recording captures the whole execution history – every line of code in every thread, every variable, every I/O.
So any developer can:
- Explore how the code is executed dynamically
- Understand code flow
- See exactly what happened and how it happened
Unlike GDB, developers can now see what thread altered what data, when a variable last changed value, or if a timer went off and allocated some memory that had been incorrectly freed.
Integrates with all popular CI / test automation tools and IDEs


Available for Linux Applications
- C
- C++
- GO
- Java
- Kotlin
- Rust
TRUSTED BY INDUSTRY LEADERS


