Time Travel Debugging
UDB is an interactive time travel debugger for Linux C/C++.
Debug a live process and replay the process’s execution history to get instant visibility into what your process just did, and why. No more guesswork!
Ideal for quickly debugging all types of bugs – especially the hardest ones which remain unresolved or can take days to find, such as race conditions or memory corruption issues.
Watch the video to see how it works.
Travel Back in Time with UDB
Simply follow the trail that leads you back to the root cause of the issue.

Fix bugs faster by reducing debugging to one cycle: from symptom to root cause.
Travel forward and backward in time to inspect program state at any point in the execution history
Understand code flow in unfamiliar codebases
Watch How It Works
UDB delivers the full power of a modern debugger with variable and memory inspection, scripting, conditional breakpoints and watchpoints – all available in forward and reverse directions.
Easy to use if you’re already familiar with GDB. Also available as a VS Code extension if you prefer IDEs.
100% compatible with GDB so no need to learn a new tool, just a handful of new commands.
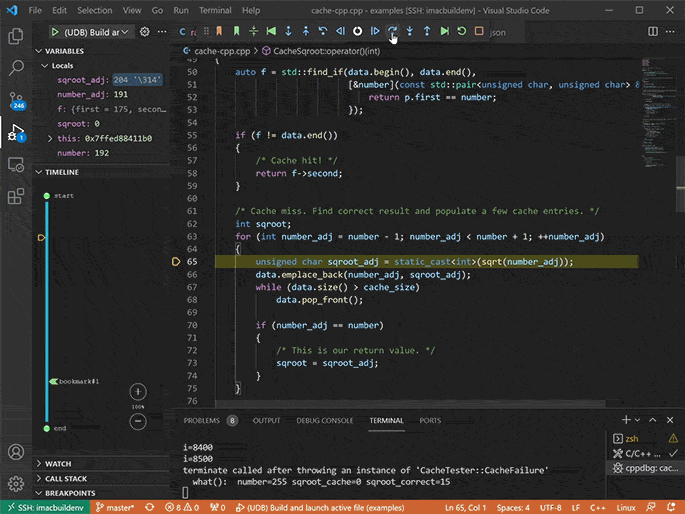
Also Available as a Visual Studio Code Extension
Working in Visual Studio Code?
Integrate UDB into VS Code to debug directly from your preferred IDE. View the documentation for more information.
You can also use UDB in CLion, Eclipse, and Emacs.
Get VS Code ExtensionFix Concurrency Bugs
Multithreaded and multi-process application architectures help improve performance, but they also increase the risk of challenging concurrency defects occurring, such as race conditions, shared memory corruption, or deadlocks.
UDB is ideal for rapidly debugging concurrency defects.
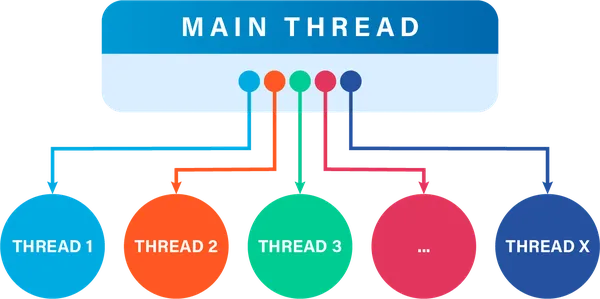

Multithreaded and multi-process application architectures help improve performance, but they also increase the risk of challenging concurrency defects occurring, such as race conditions, shared memory corruption, or deadlocks.
UDB is ideal for rapidly debugging concurrency defects.
Read the tutorial on how to debug C/C++ race conditions with UDB.

Debug Memory Management Issues
UDB is also used to rapidly identify the root cause of programming errors related to memory management, such as:
- Segmentation faults due to memory access violation
- Double free
- Memory corruption, i.e. user after free errors, memory leaks
- Stack corruption, i.e. buffer overrun
These can be hard to debug since the root cause may no longer be in scope. With UDB, you can see what went wrong by just travelling back in your program’s execution history.
Understand Code You Didn’t Write
Working on complex unfamiliar code you didn’t write?
- Quickly understand program behavior by navigating forward and backward in the program’s execution history
- Watch variable and memory changes as you navigate, forward and in reverse
- Reduce onboarding ramp time: enable new joiners to get up to speed with the code faster
What developers are saying
Expert Debugging Assistance
Have an urgent problem you need to fix right now?
Don’t worry! Just book a slot with one of our engineers below. We’ll work with you to solve your problem. No strings attached.
UDB runs on most modern Linux distributions and supports both 32 and 64-bit x86 programs. For more details, see the full list of system requirements.
Just UDB binaries.
No, only user space.
We use binary instrumentation to capture only the bare minimum data required to record execution as efficiently as possible. To keep the overhead low, we don’t translate instructions that don’t require it.
Yes.
UDB is currently used on some of the world’s most complex software, including heavily multithreaded applications and those using shared memory.
Check out the UDB Quick Reference guide for the full command set available.
UDB is an interactive time travel debugger used by a single developer in inner-loop development. UDB is a component of Undo.
Undo provides a team solution by integrating into your CI / System Test / Bug Tracker. In so doing, you can:
- Automate recording of test failures
- Store recordings for root-cause analysis days or weeks later
- Collaborate on recordings across teams for effective asynchronous collaboration (recordings are portable and shareable)
- Access the thread fuzzing capability to expose concurrency bugs in multithreaded codebases
- Access the multi-process correlation for shared memory functionality
Yes! We have an Educational License Program in place. Register your interest here
