Resources
Setting up UDB within DDD
Author: Aditi Sundaram (Undo Sales Engineer)
A quick guide to time travel debugging using DDD
In my first 3 months at Undo, I was asked again and again about DDD, the Data Display Debugger born out of the GNU Project. DDD is a graphical user interface UNIX debugger which is often of particular interest to developers in the Electronic Design Automation (EDA) industry.
UDB is the first time travel debugger (aka reverse debugger) for Linux, fast enough, and with memory consumption low enough, to be used on complex code. In this post I aim to show how to use the UDB time travel debugger with DDD, to debug your code. But first, here’s a quick overview of what’s useful about both tools.
Why DDD?
In addition to typical front-end features such as viewing source texts and breakpoints, what is distinctive about DDD is that it provides an interactive graphical data display, where data structures are displayed as graphs. You can find detailed information about debugging with DDD in the online manual.
Why UDB?
What makes UDB different from basic debuggers, is that time travel debugging eliminates the iterative guesswork that’s often necessary as part of defect diagnosis. Time travel debugging allows developers to travel backward, by capturing data down to the instruction level. UDB then recreates the entire memory and register state of the process, with minimal overhead and slowdown.
Analyzing code behavior and time traveling backward through code enables faster root-cause analysis and helps find the defect from the point of the crash, in a single run. This method of debugging is powerful enough to capture complex concurrency bugs, it accelerates time spent tracking down root causes of errors and, overall, it reduces the amount of time a developer has to spend debugging. Fundamentally, time travel debugging is also a vital method by which we can understand the runtime behavior of complex codebases.
Setting up UDB within DDD
To run UDB from within DDD, we simply need to start the DDD executable with the –debugger parameter.
In our example, type the following in the terminal:
ddd --debugger /path/to/udb /path/to/program
Hit Enter.
If the prompt shows “not running>” , reset it with:
set prompt (gdb)
(Versions of UDB 6.4.3 and later already have the correct prompt “(gdb) ”.)
There is no support for reversible “buttons” in DDD. However, we can still use the usual forward buttons available.
To use UDB’s backward capabilities, type the UDB commands into the GDB console section of the DDD window. For example:
reverse-step
watch -l
bt
Only forward commands move the green arrow that shows the line of code currently in execution. Reverse commands can be tracked by cursor movements (does not have the arrow feature). Forward commands such as undo and redo work with reverse commands too.
A demo of using UDB with DDD
We will use one of the example programs that ships with UDB – “cache calculate” in file examples/cache.c.
Step 0: Build the example.
cd /path/to/UDB_installation/examples
make cache
Step 1: Type the command to open DDD with UDB in the terminal.
ddd --debugger ../udb ./cache
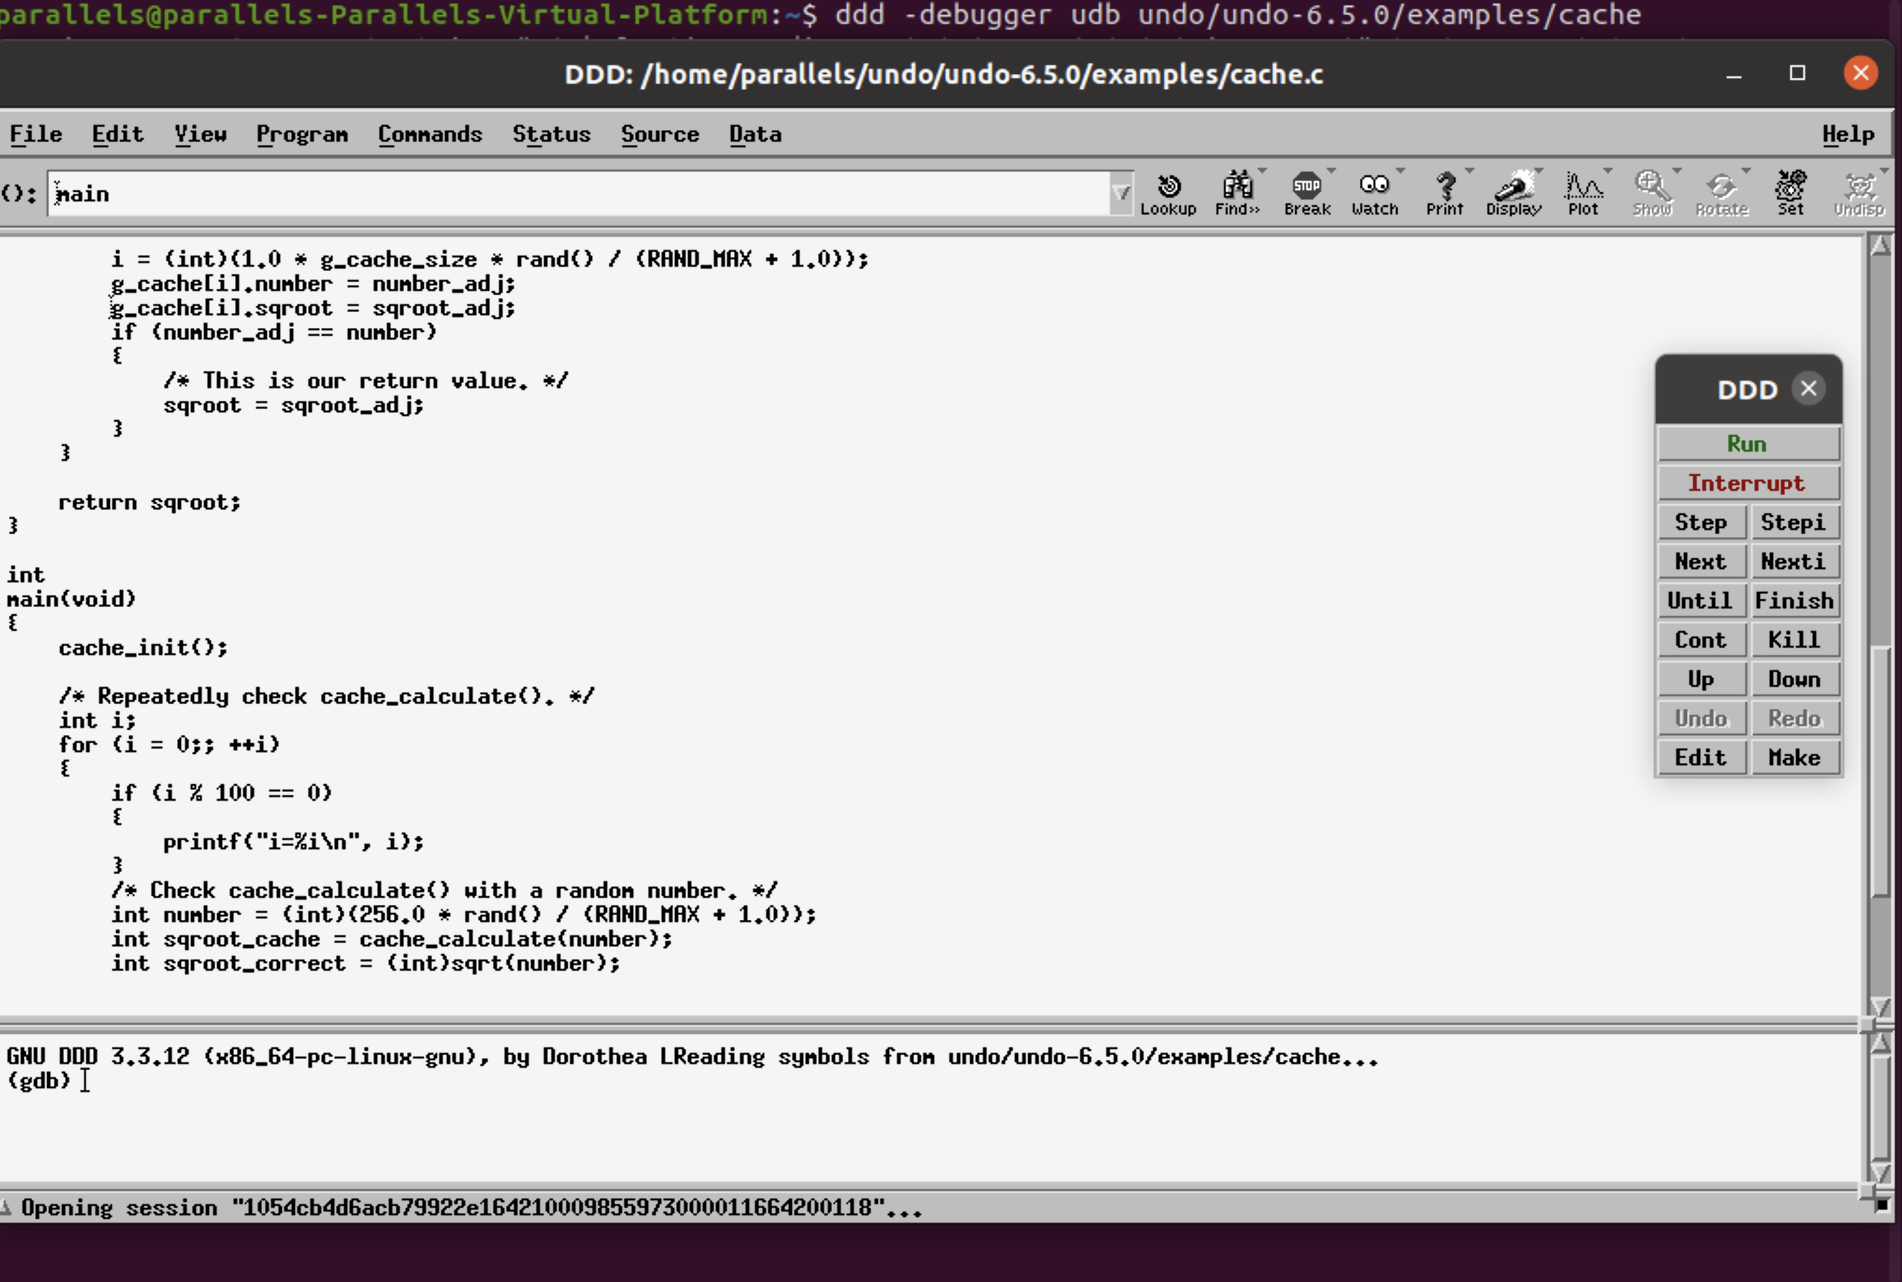
Step 2: Run the program.
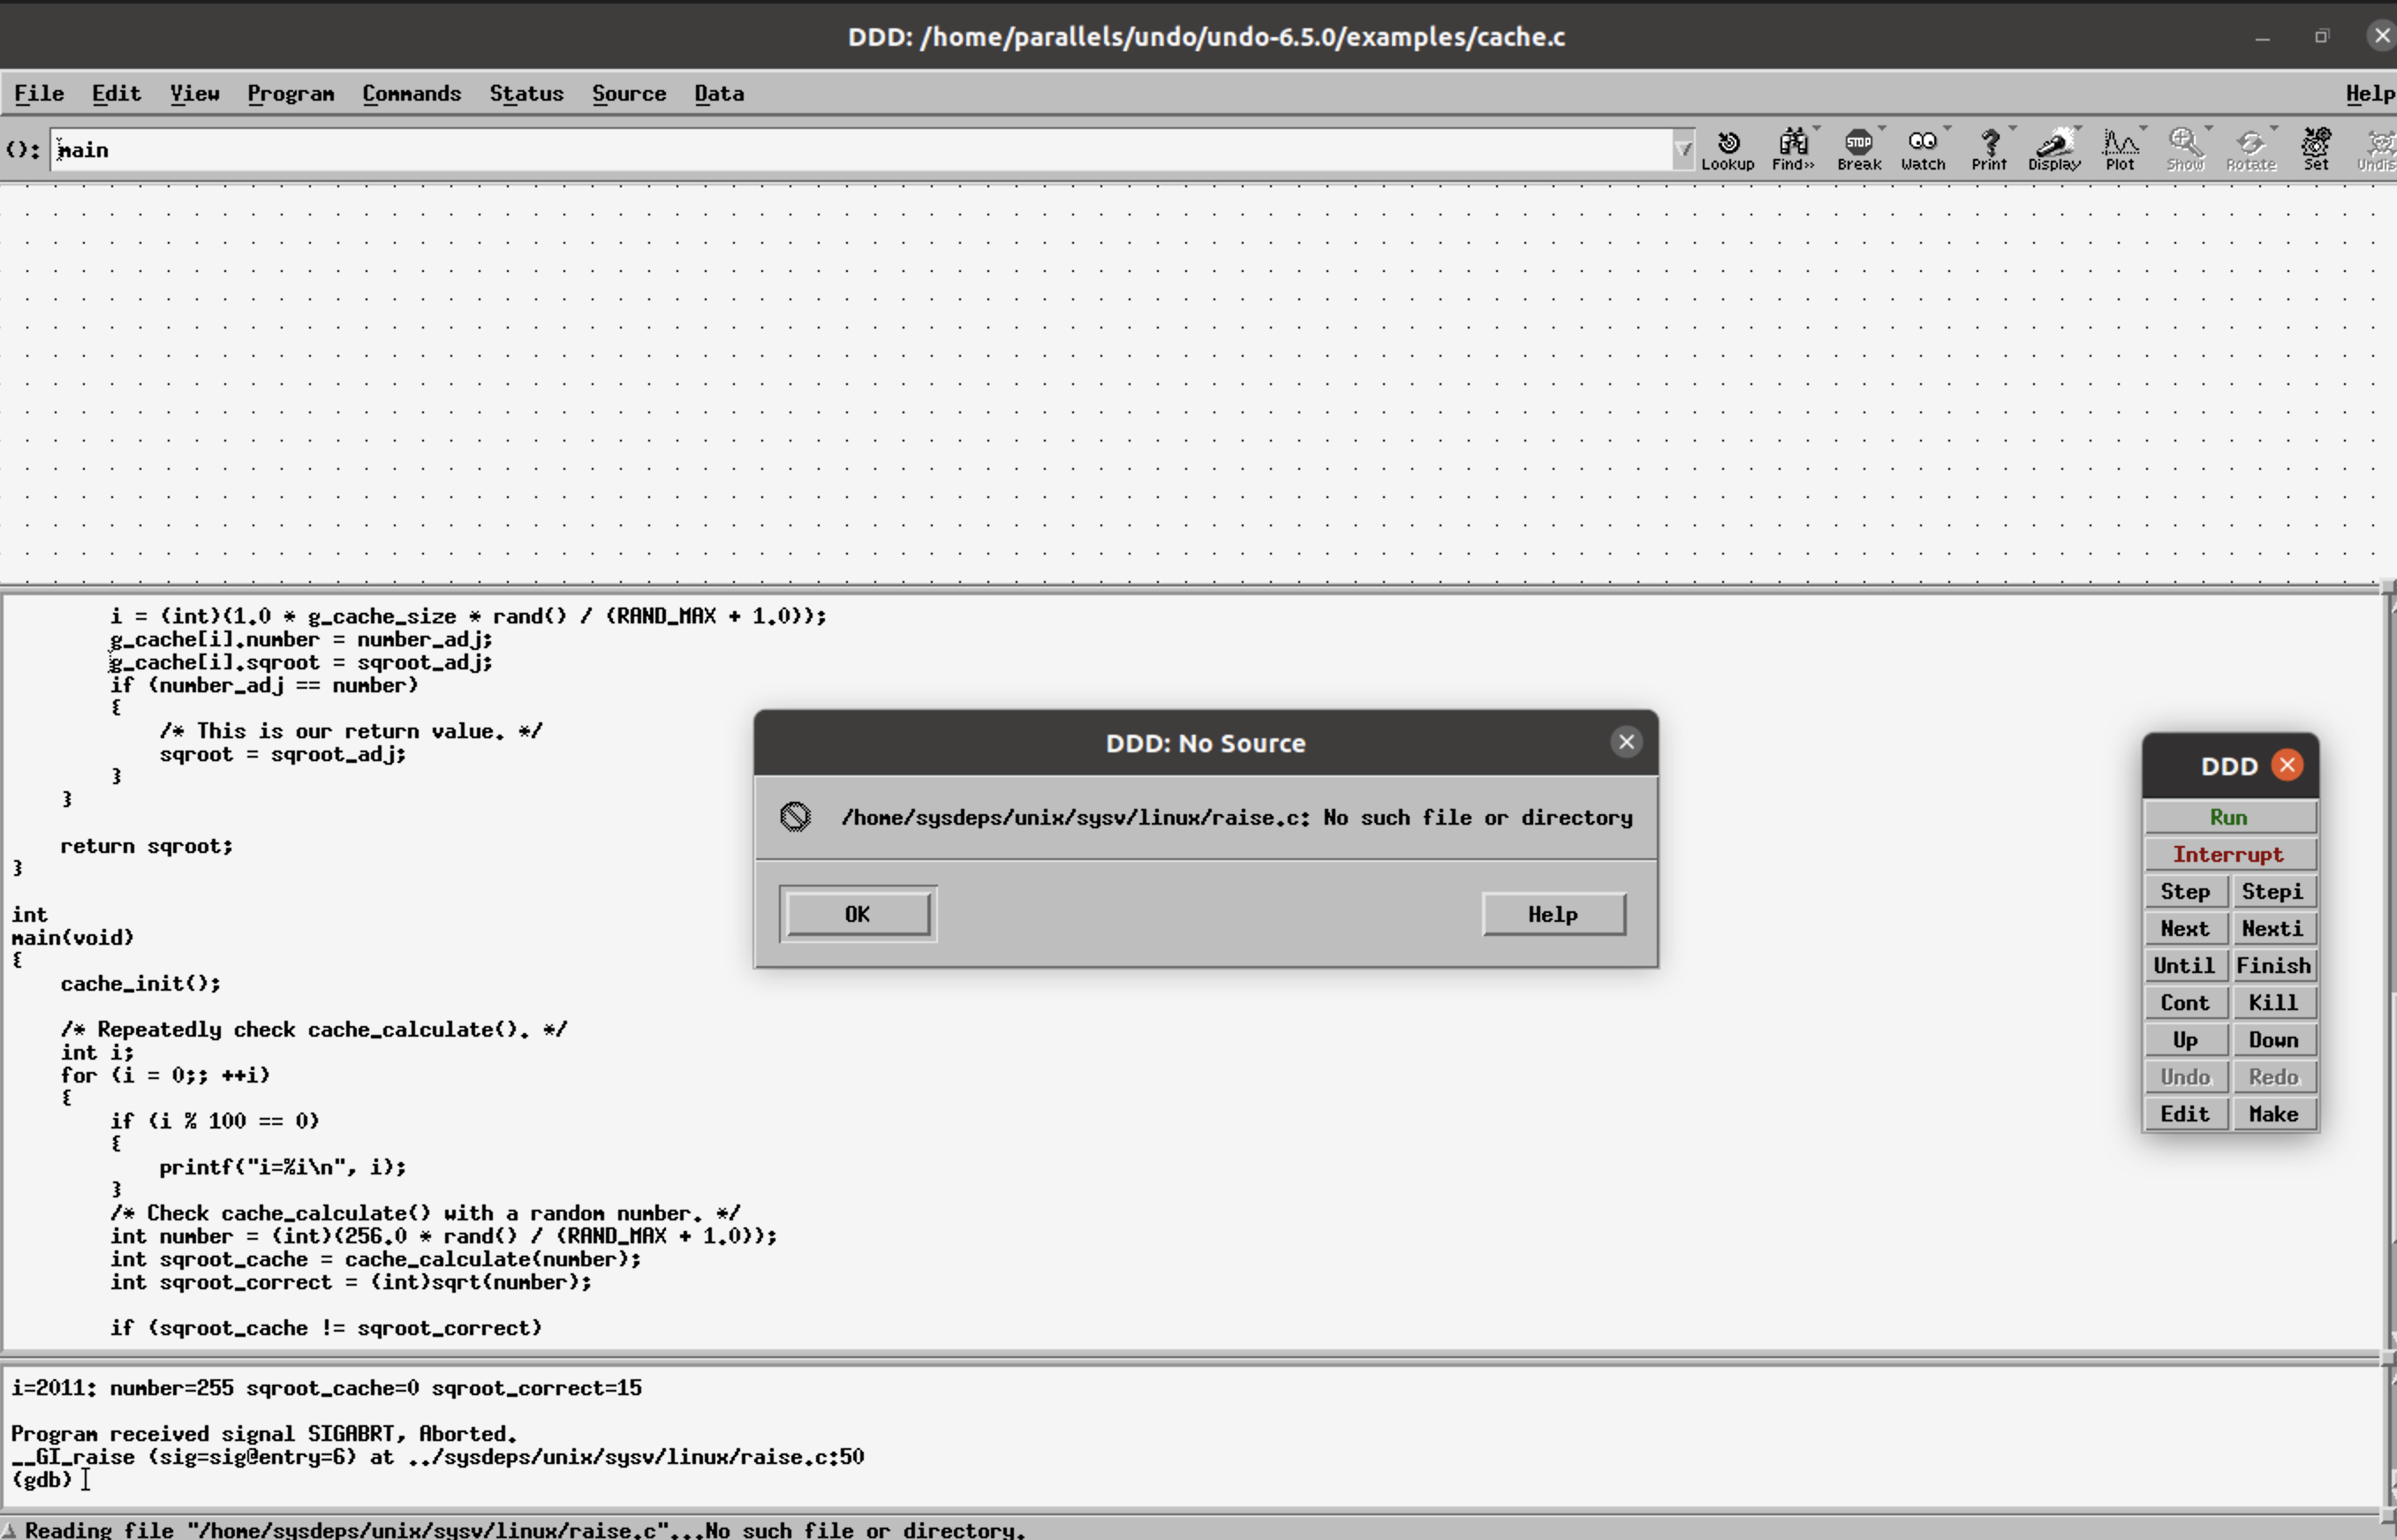
Step 3: DDD features to display data structures as graphs can be used to display the g_cache structure.
This is done using the graph display (data structure) option seen as “Display” in the top right corner. The bt command, typed in the console, shows the entire call stack.
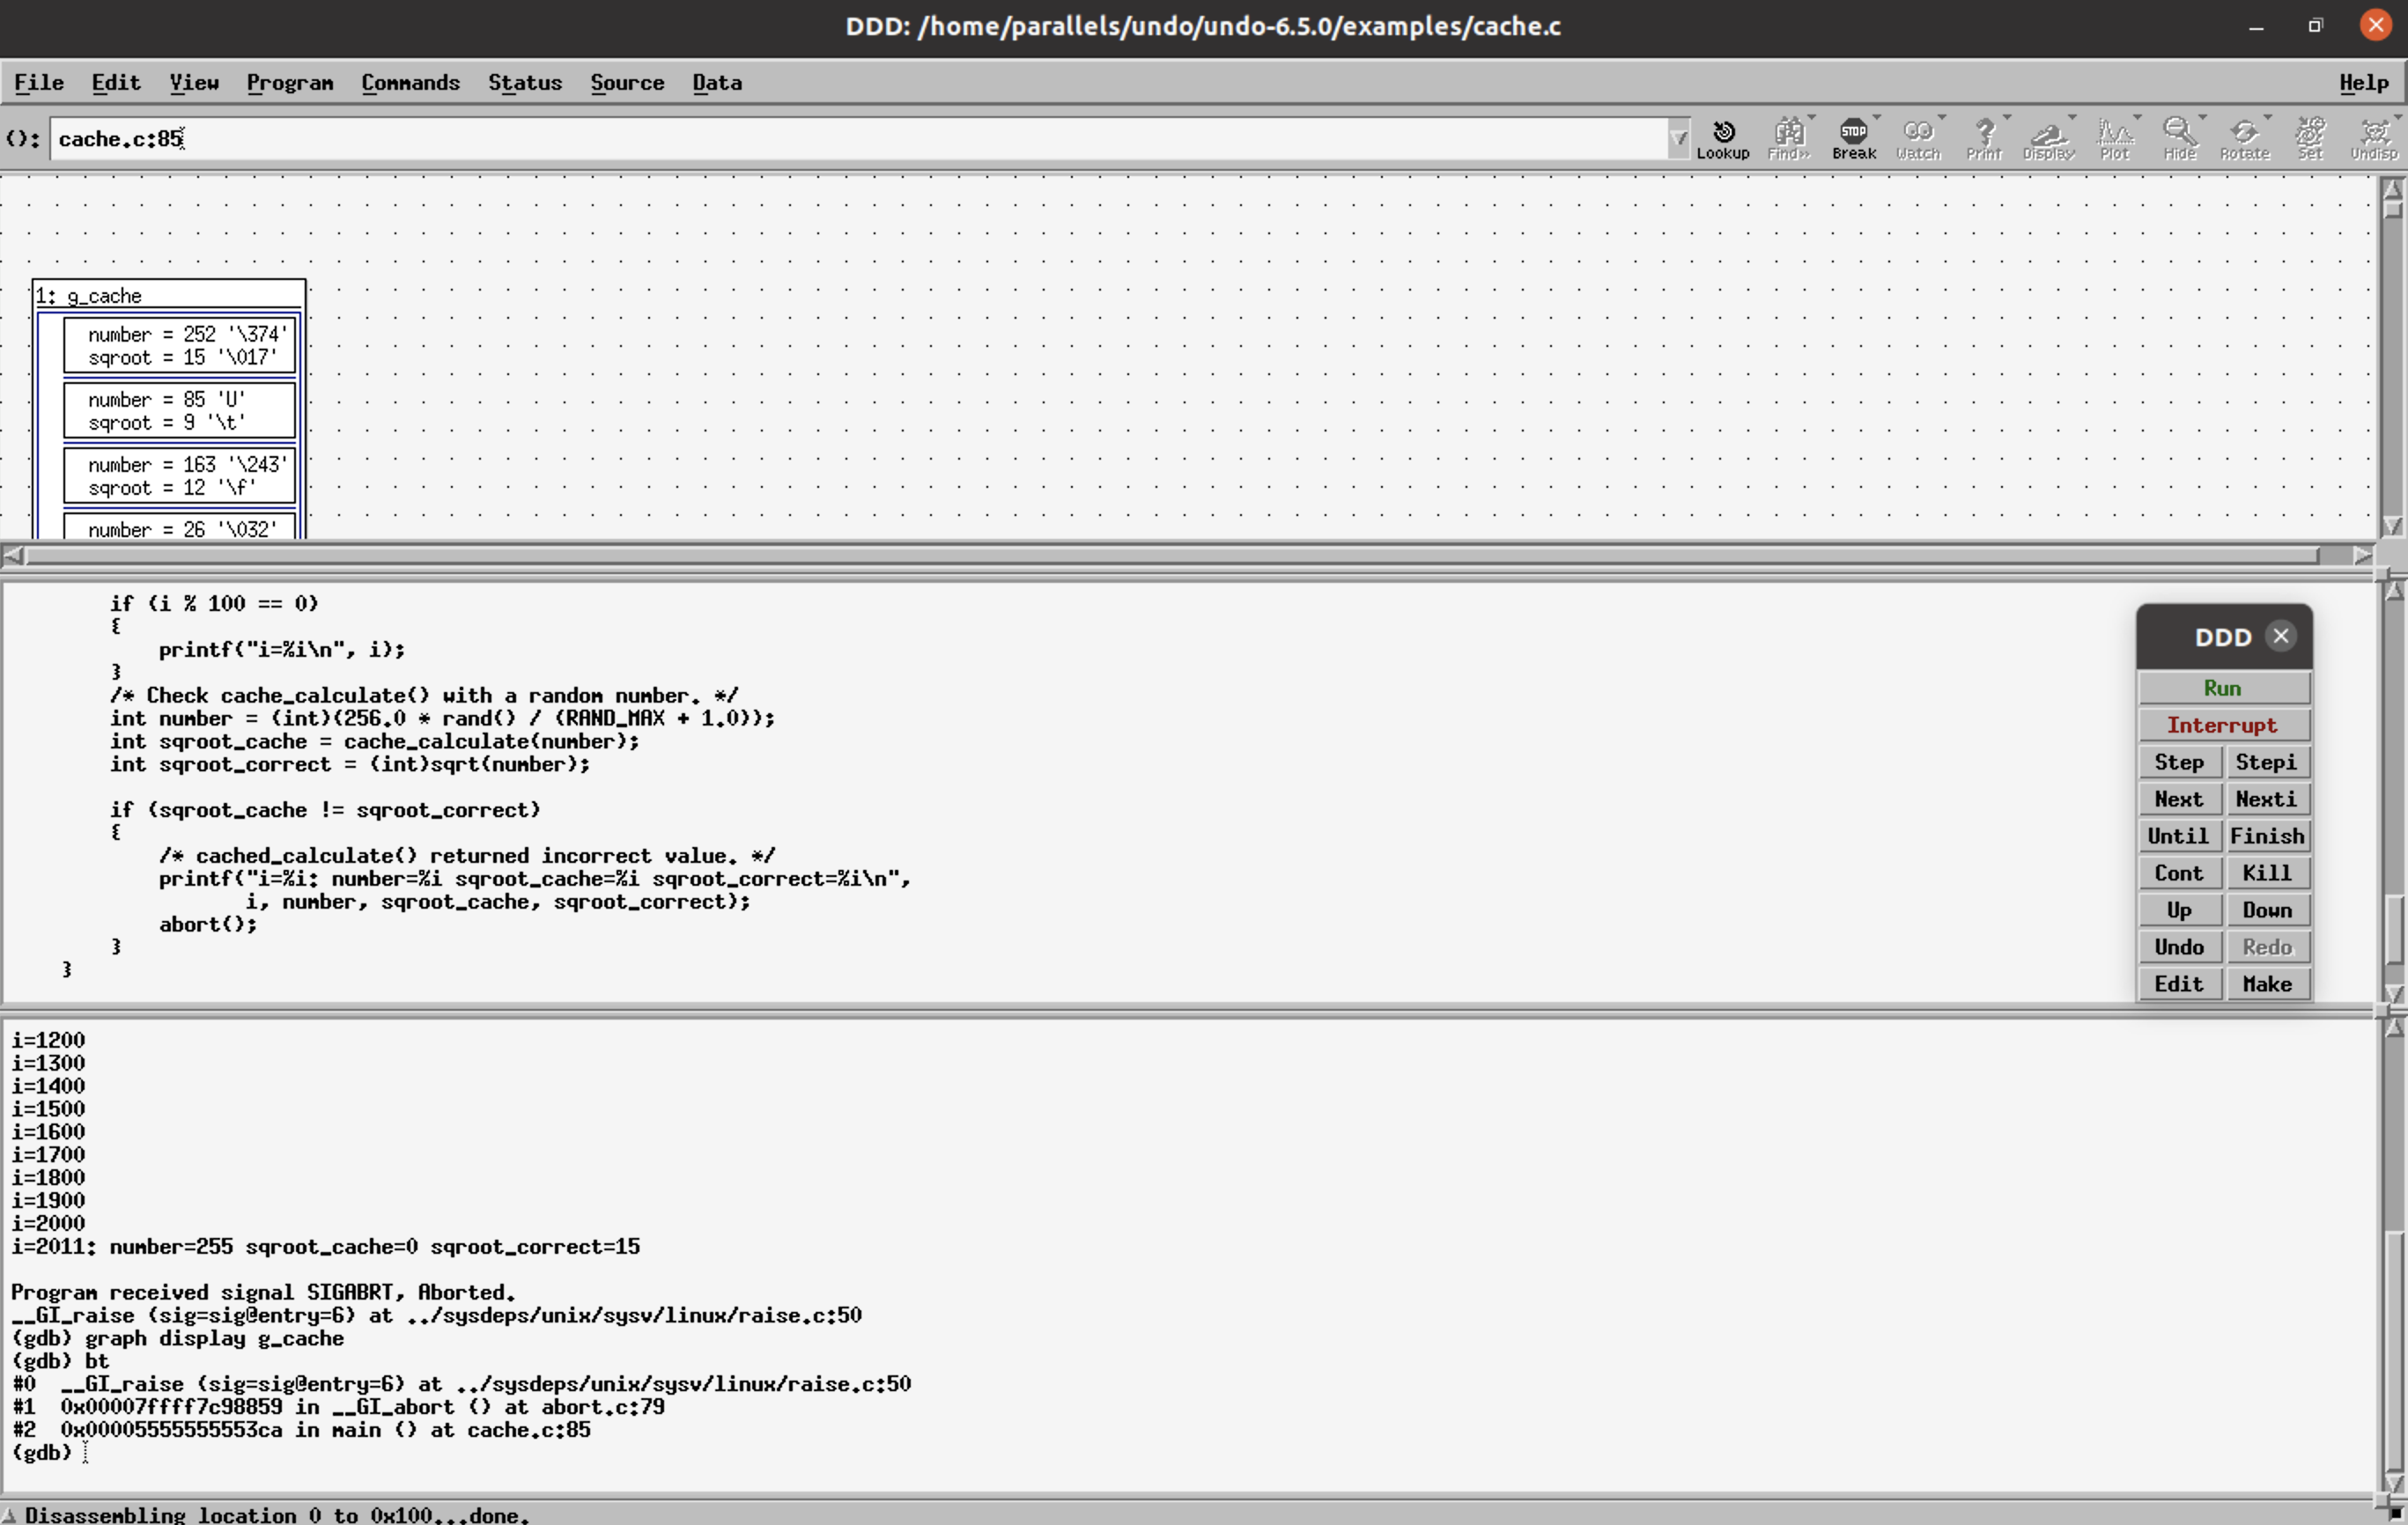
Step 4: reverse-finish (rf) to the main() function.
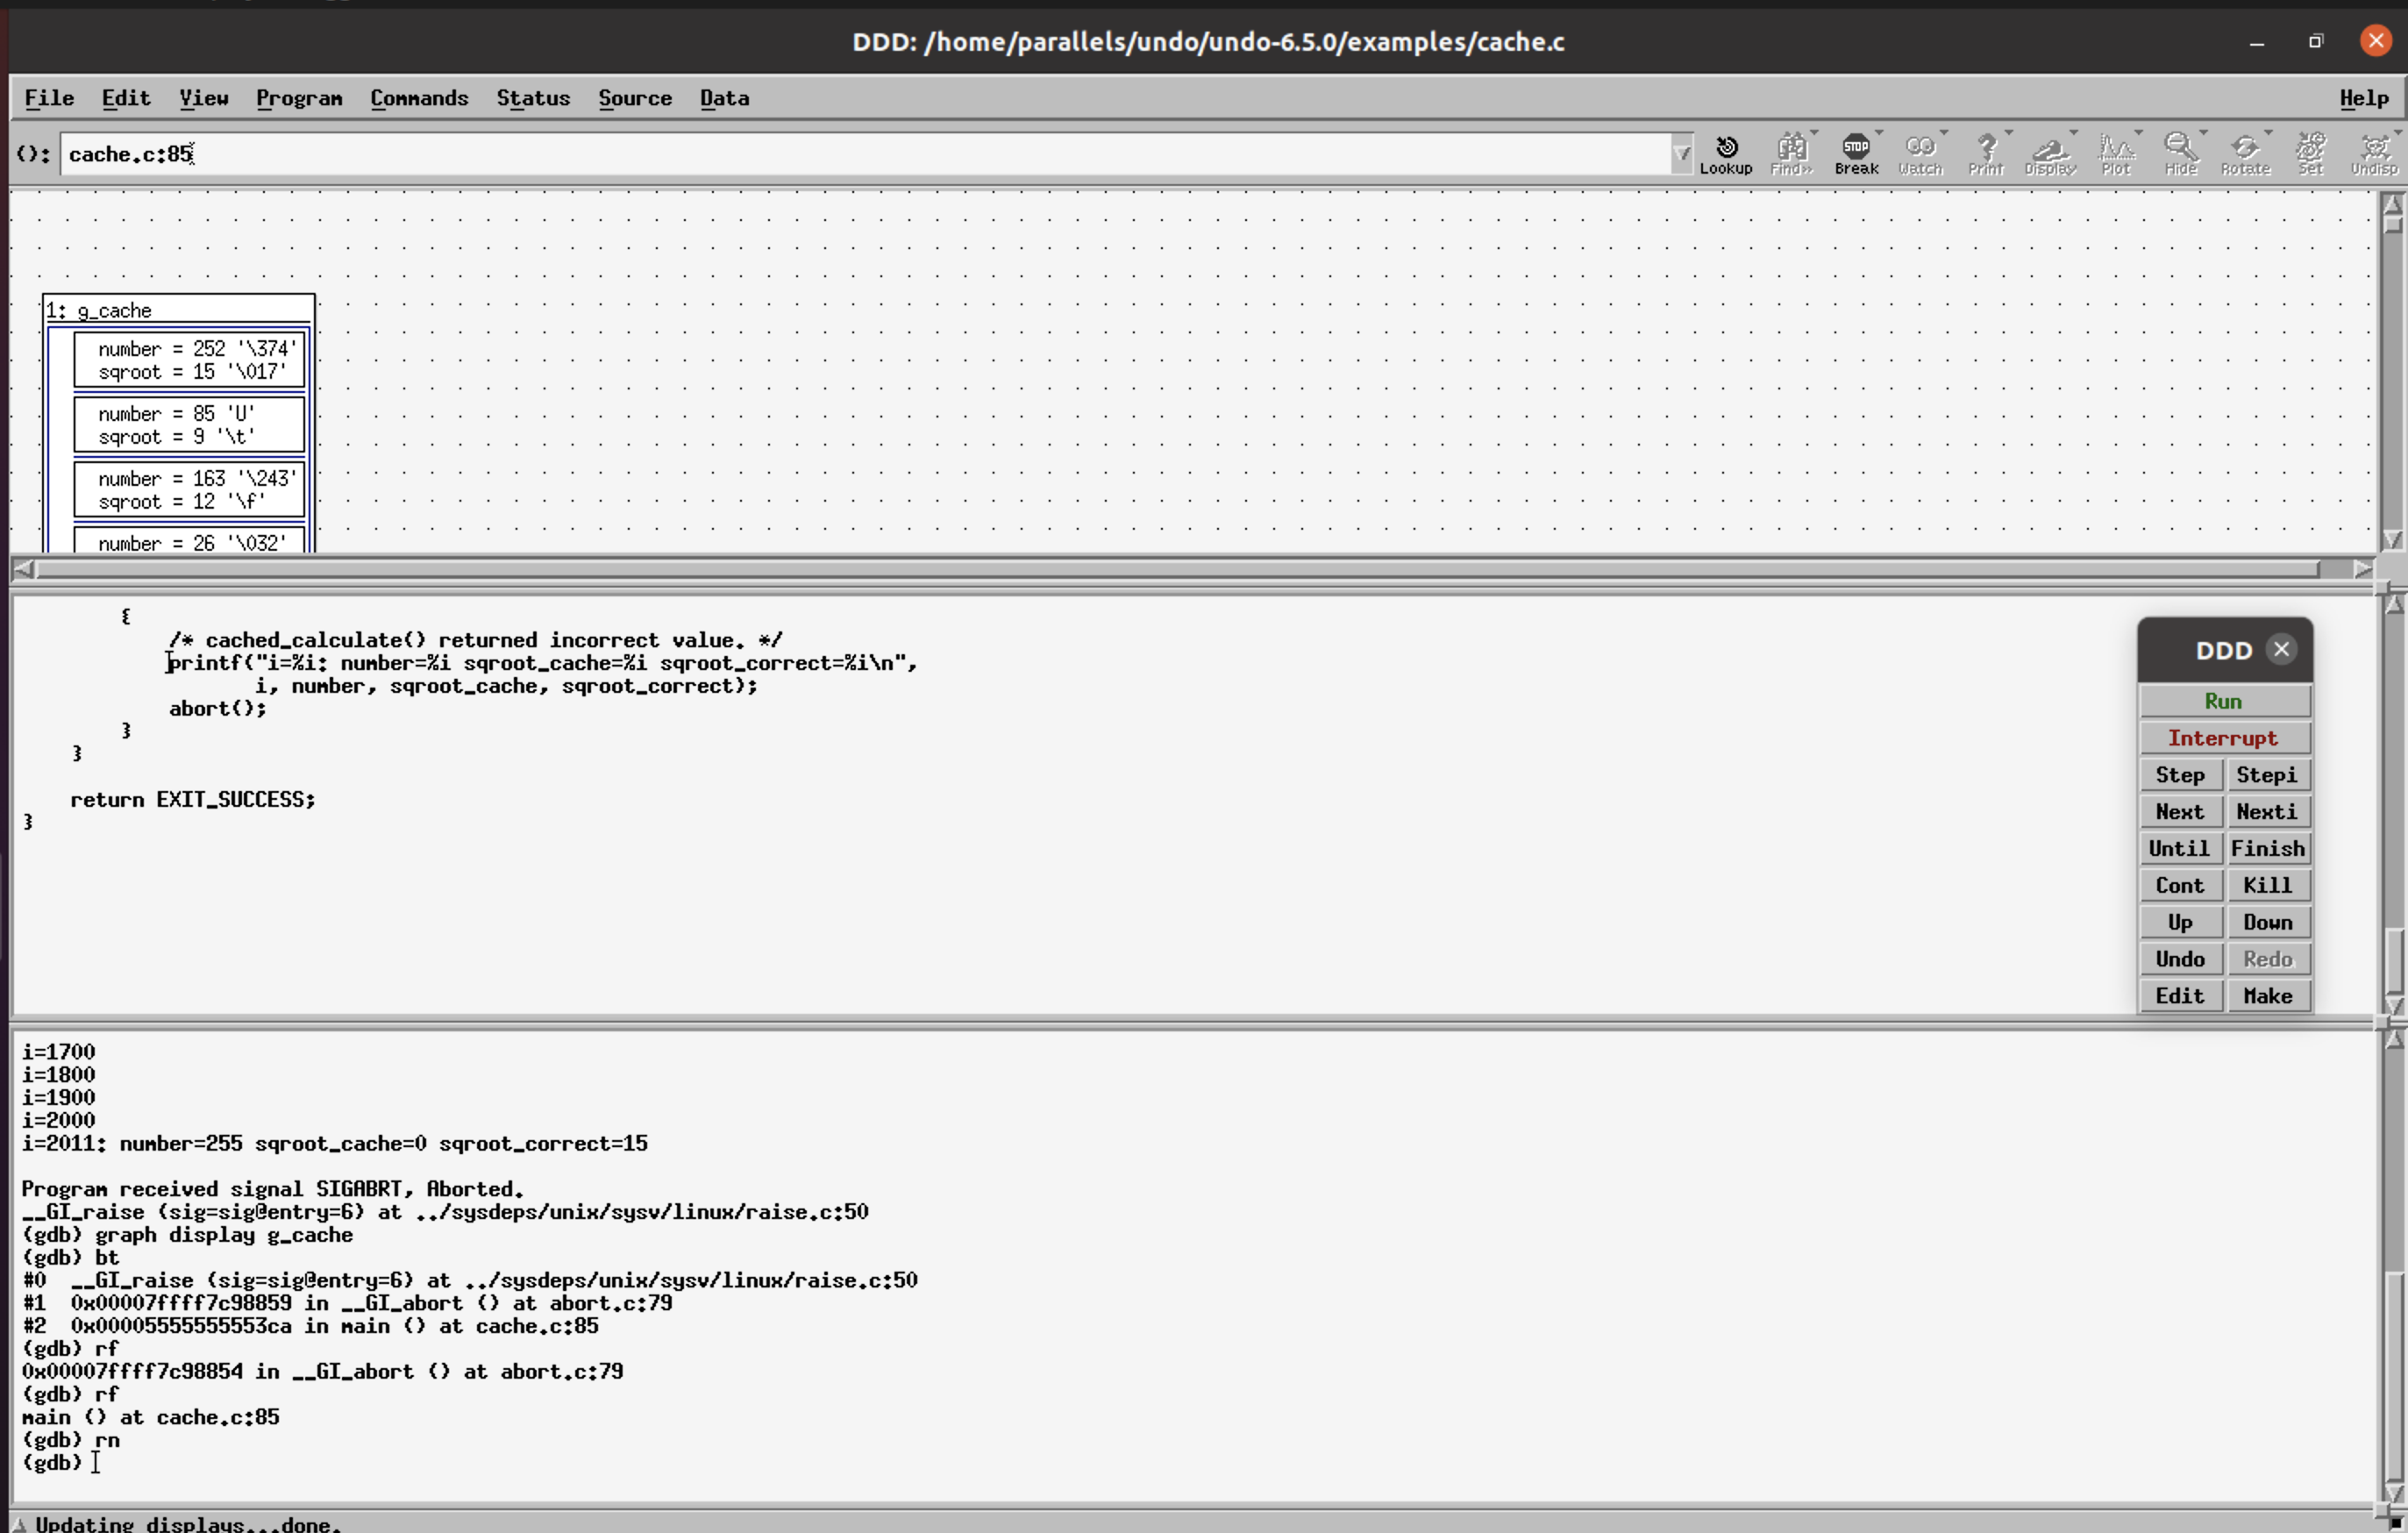
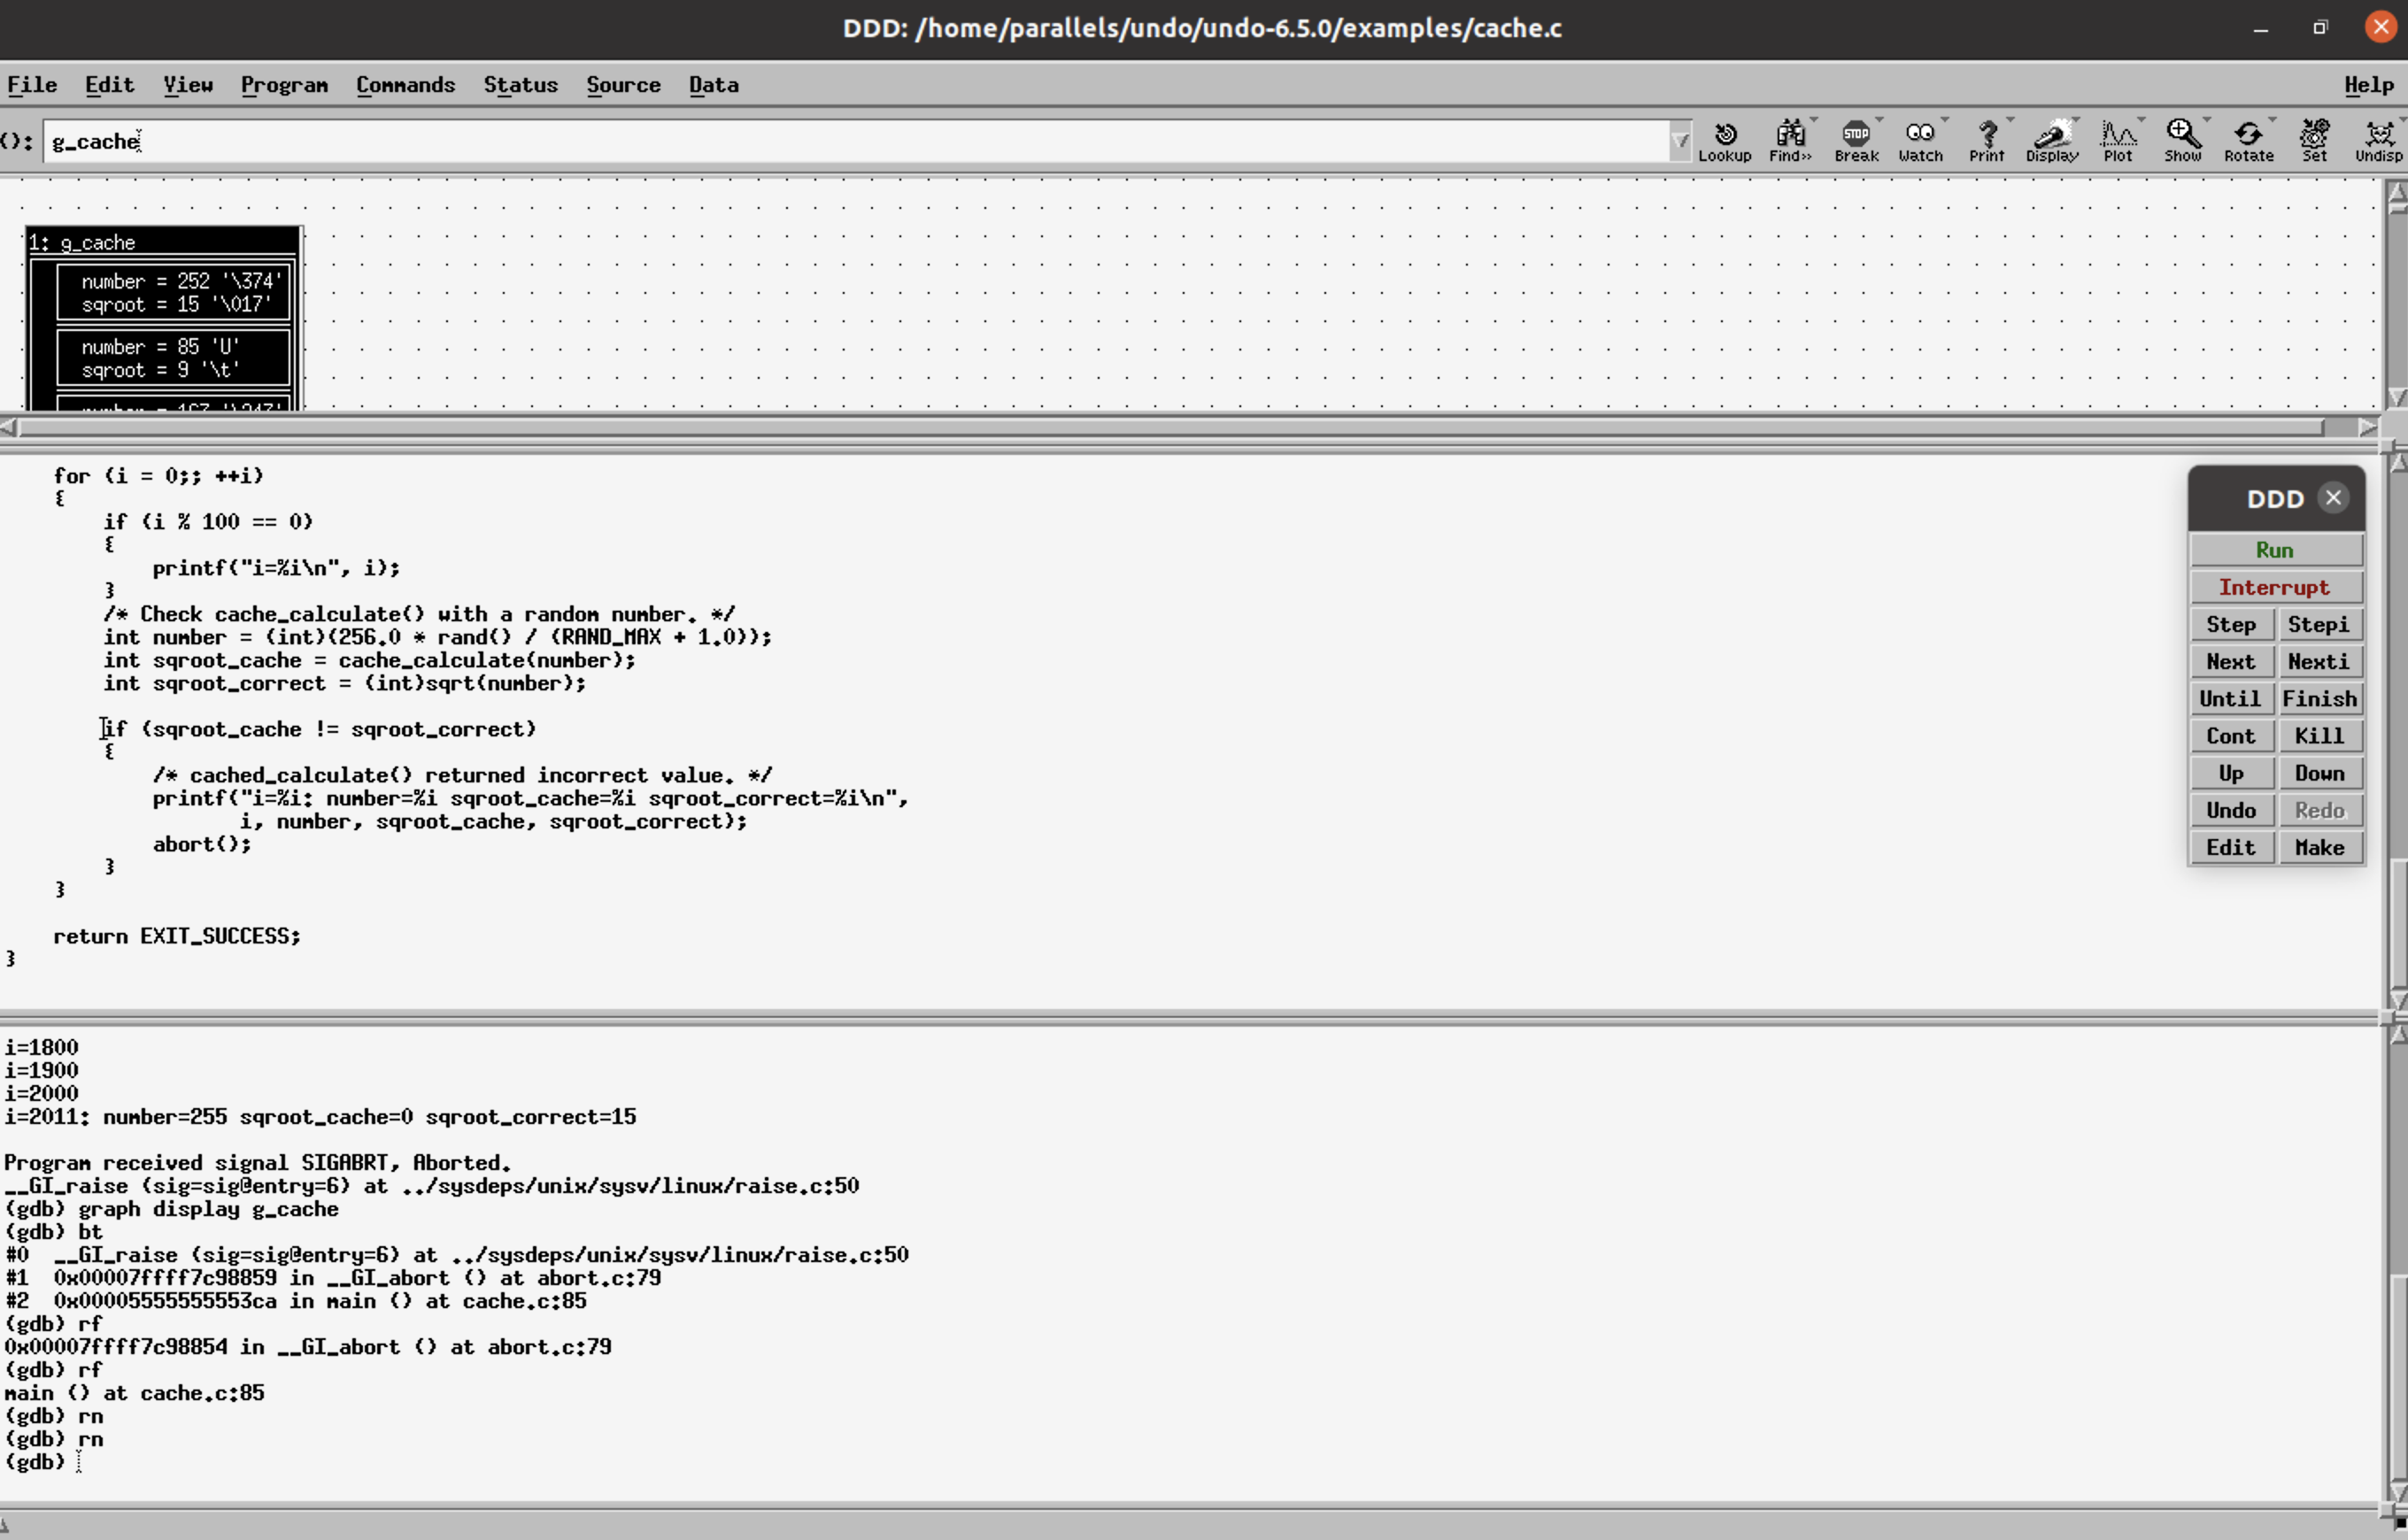
Step 5: reverse-next (or shortcut rn) to navigate the lines of code executed in the main() function before the crash.
Reverse RCA shows the variables sqroot_cache!=sqroot_correct, sqroot_cache=0. The function cache_calculate() returns the bad value, reverse-step(or shortcut rs), into the cache_calculate() function. The cursor indicates the line you are currently on.
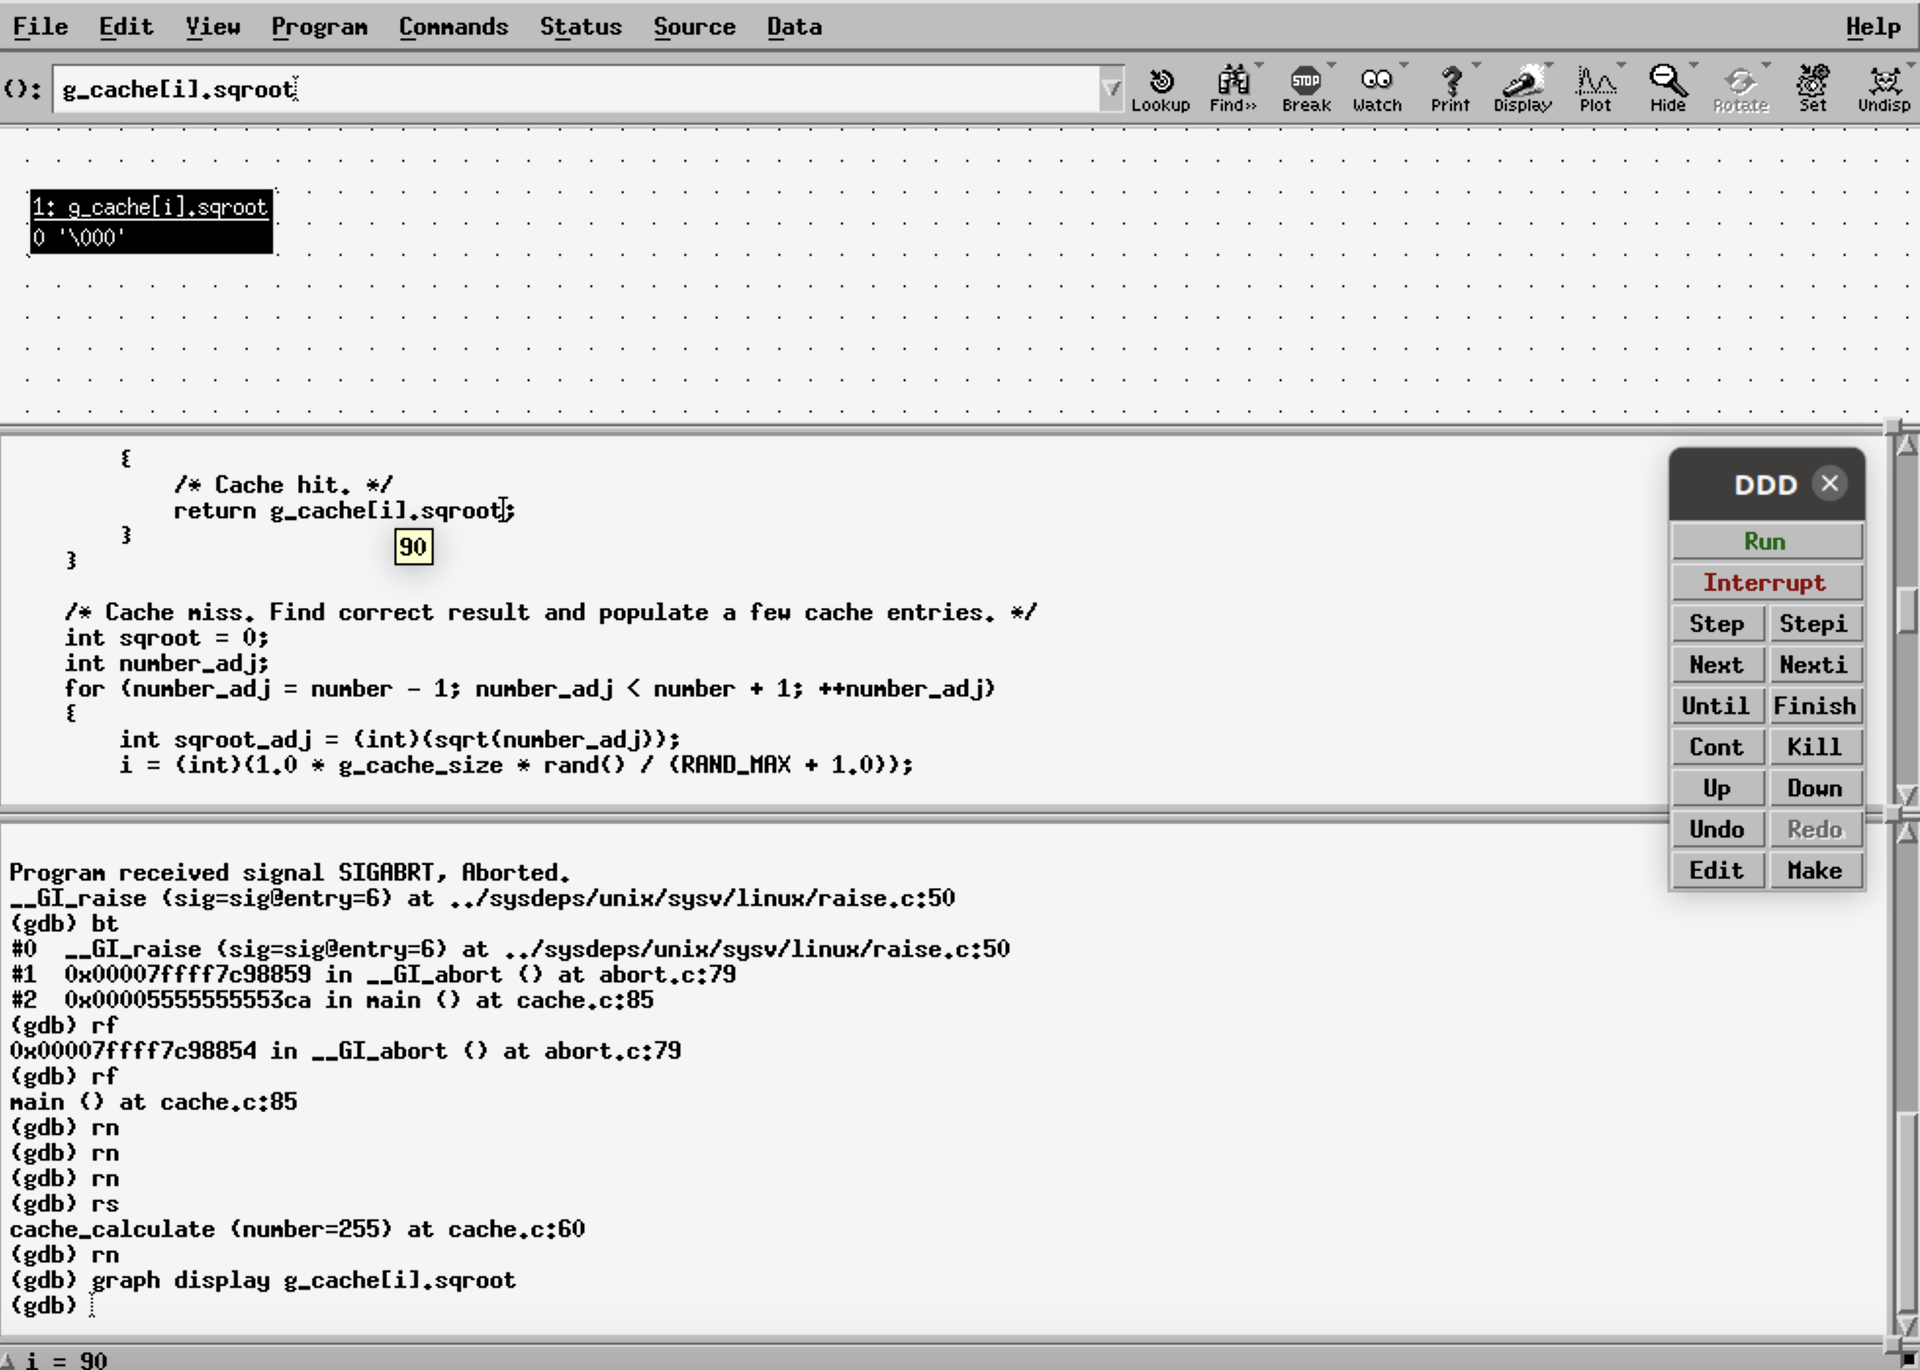
Step 6: The value of g_cache[i].sqroot has bad data, (i.e. 0) at i=90.
Step 7: Set a watch point at this location
watch -l g_cache[i].sqrootand
reverse-continue (rc).This shows when the value 0 (bad data) was written in [old value -> final/latest value, new value -> value before the old value].
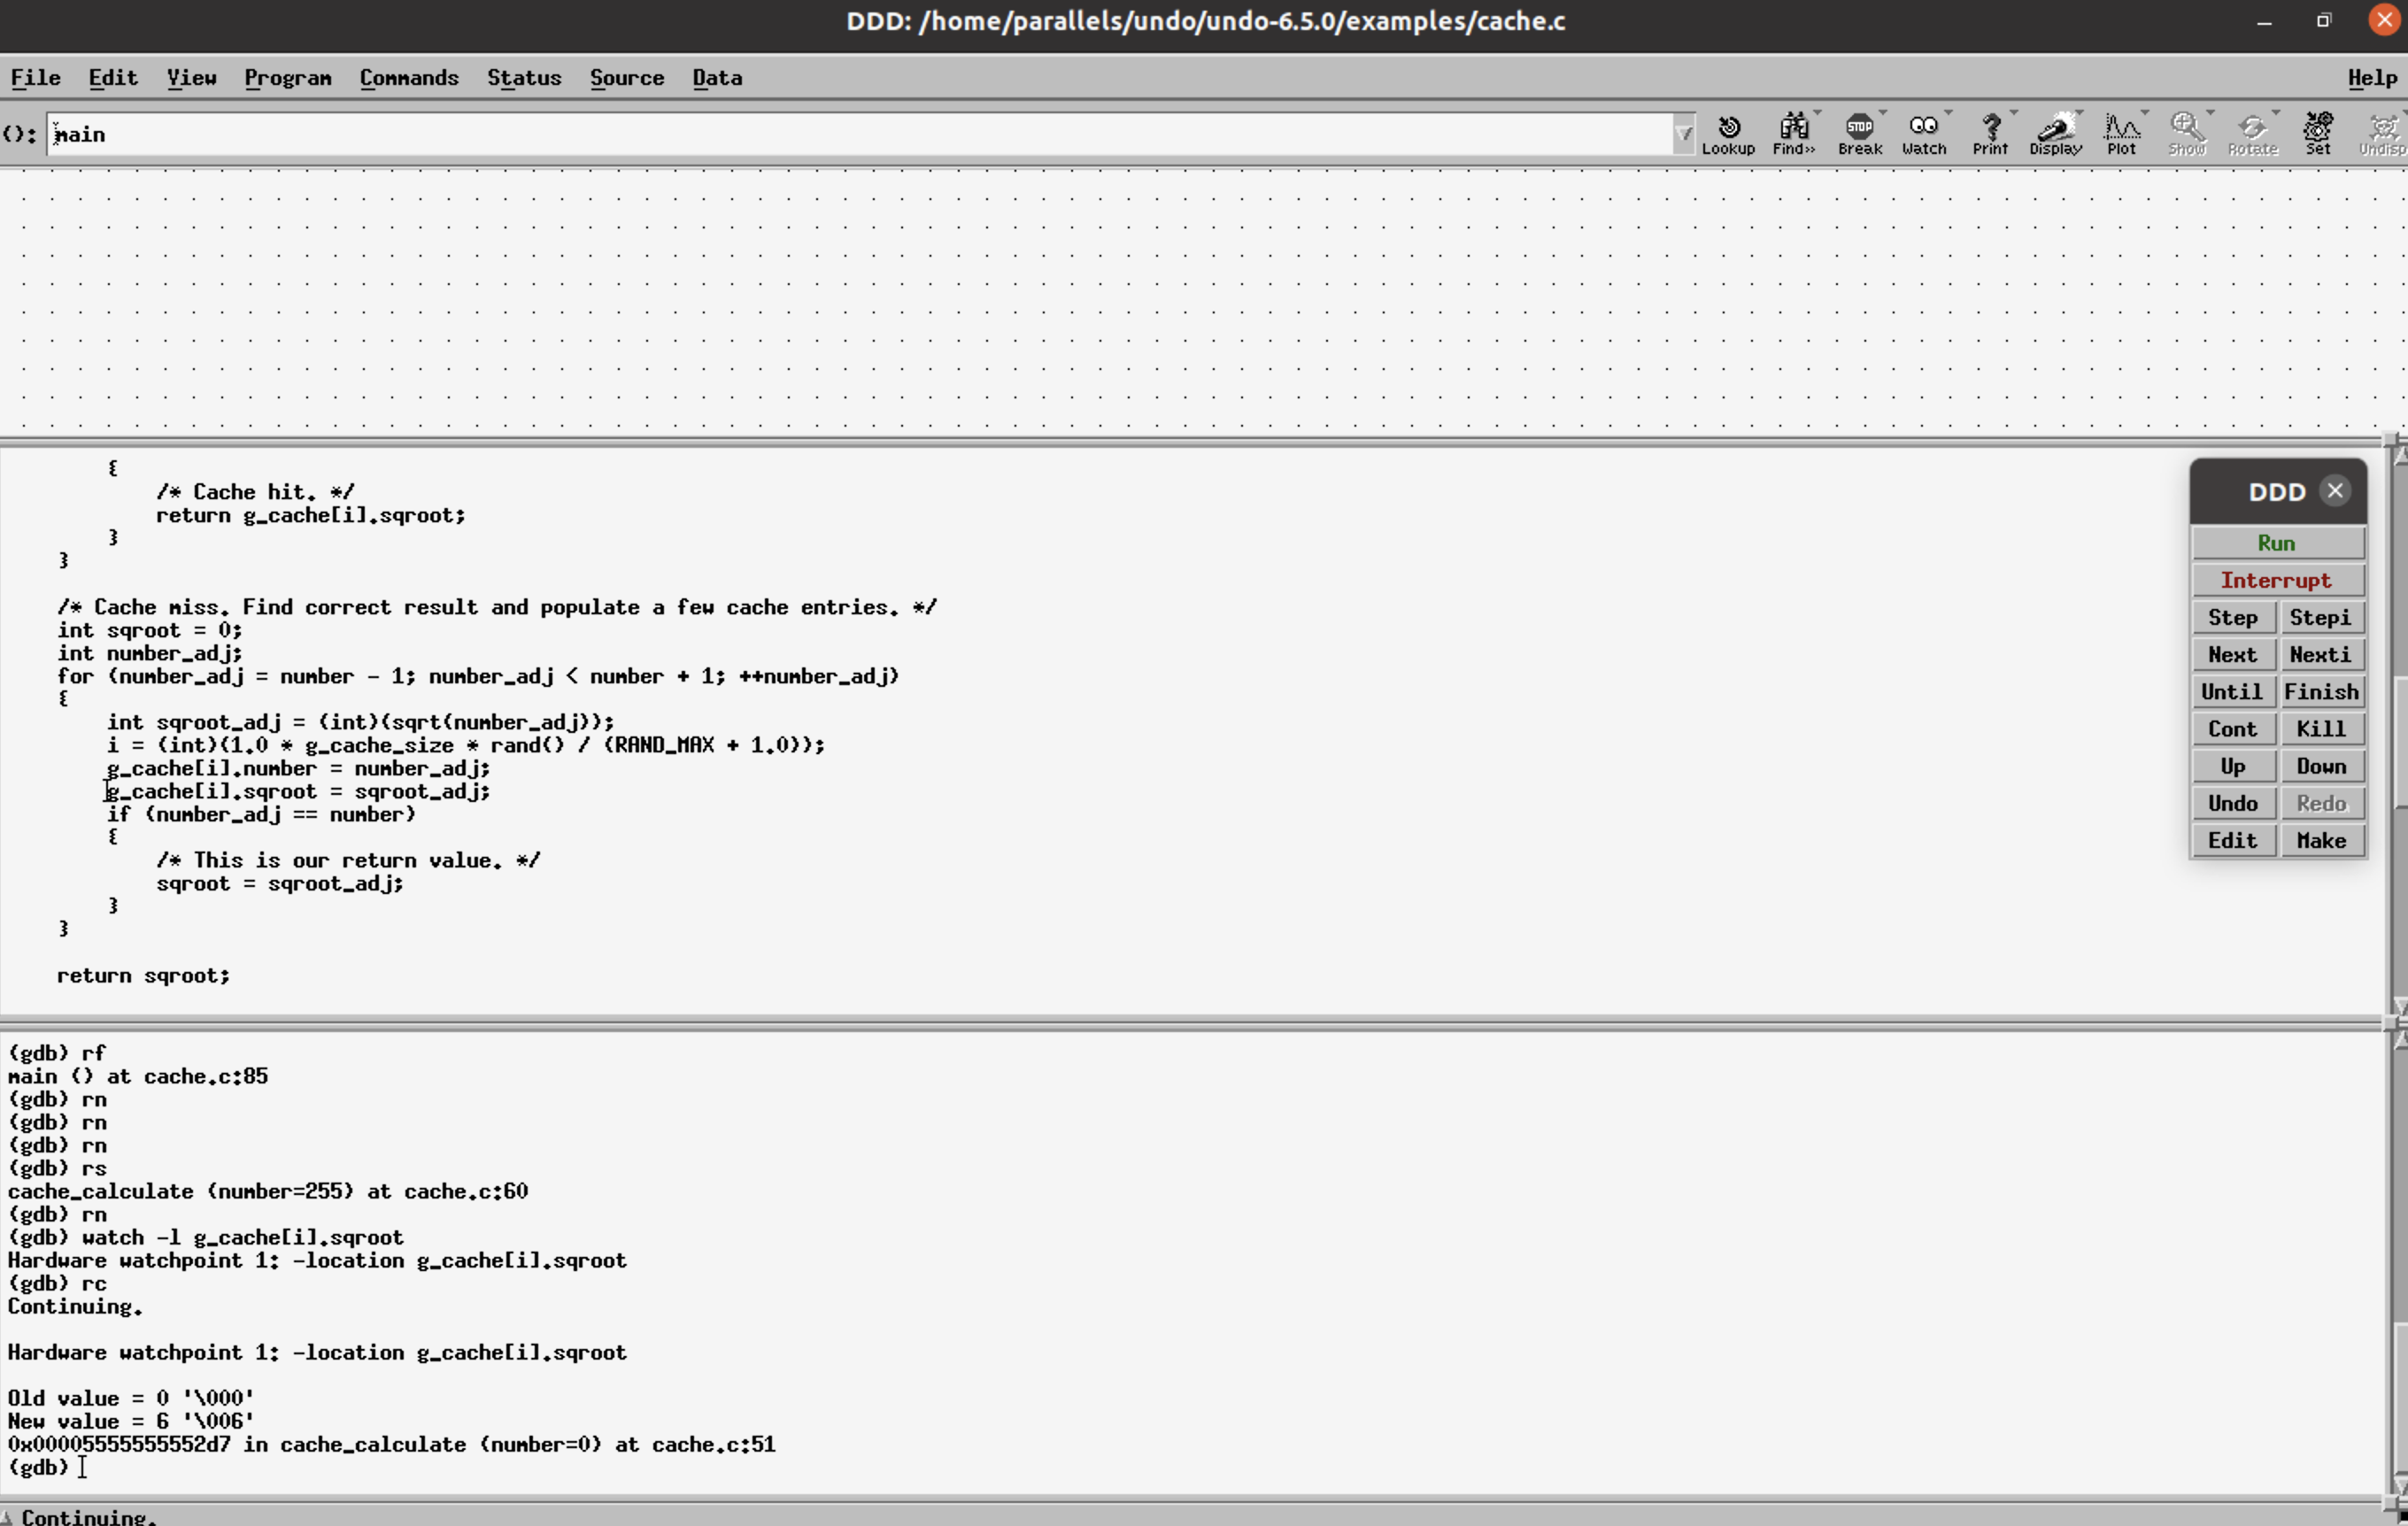
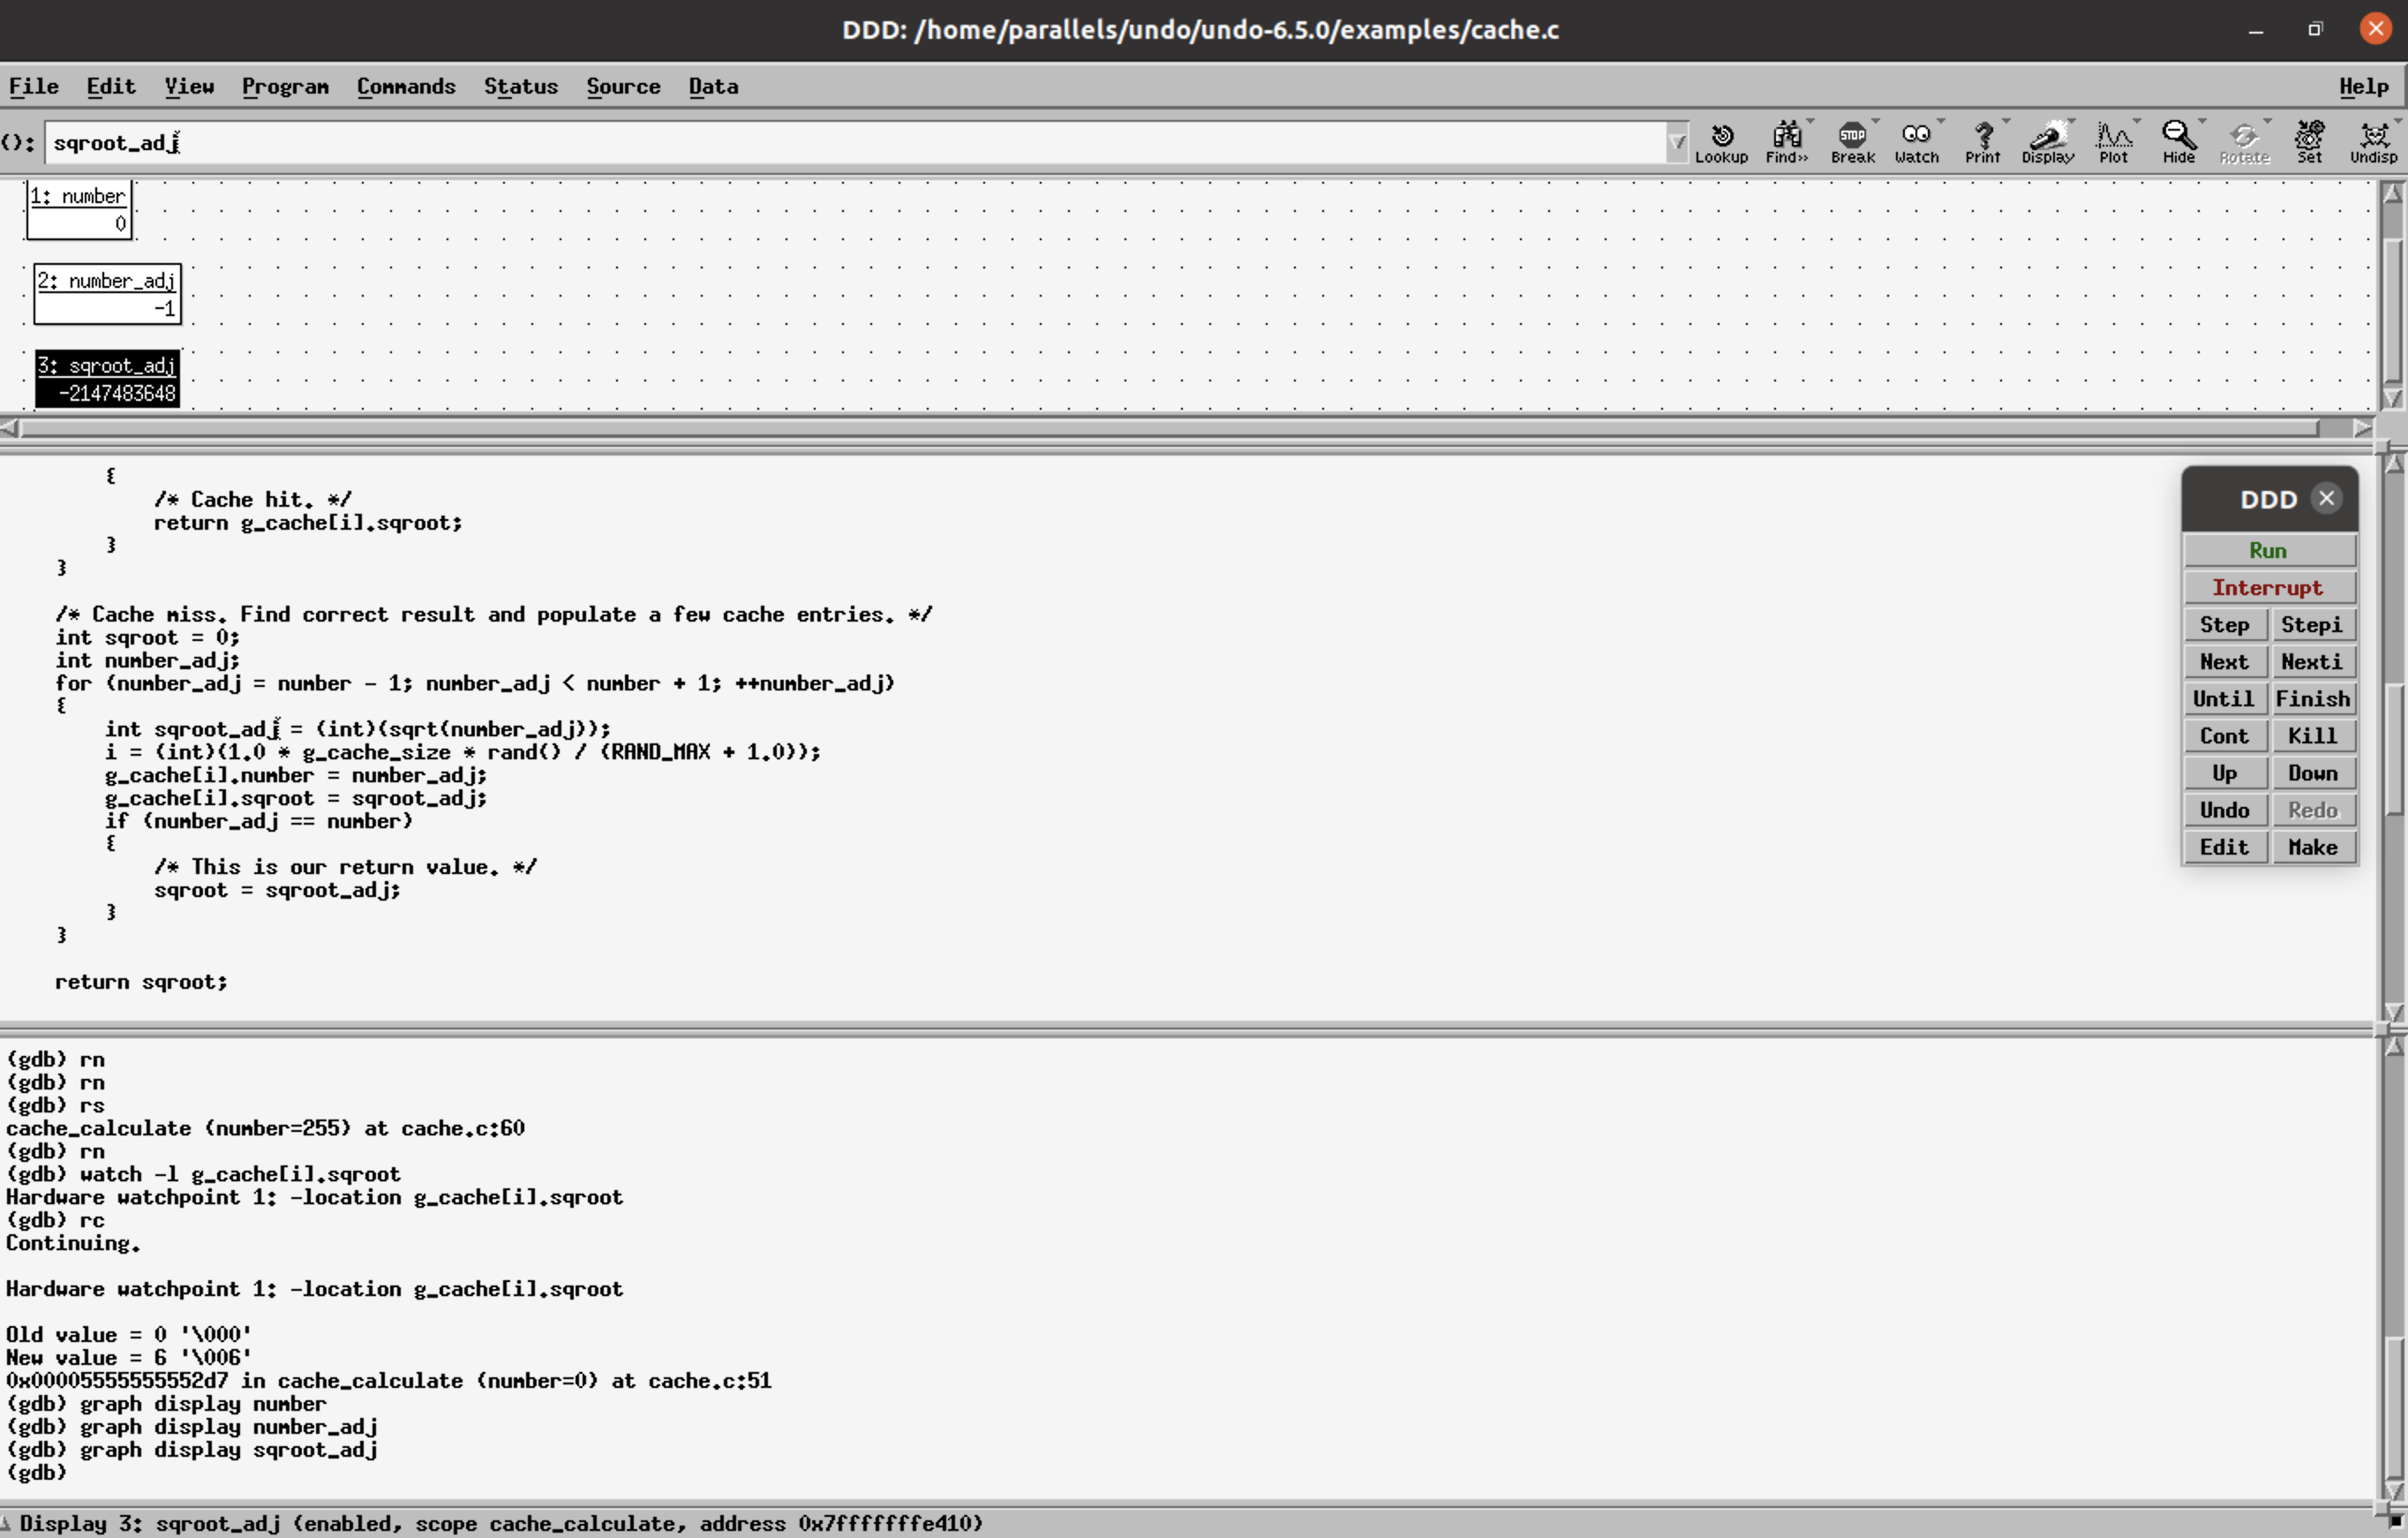
Step 8: reverse-next (rn) from this point onwards gives information of what happened right before the bad data was put into the variable.
In this case, rn shows that int number=0 so int number_adj =-1 and sqroot_adj is a negative value. These values can be displayed by selecting the variable and clicking on Display. Int sqroot_adj tries to calculate the square root of a negative number and stores a large negative integer instead.
Further inspection shows that the values of number_adj and sqroot_adj are copied into g_cache[i] members respectively.
Step 9: p g_cache[90], prints the data in the members of g_cache @i=90. g_cache.number = number_adj (= 255) and g_cache.sqroot=sqroot_adj (=0).
g_cache.number stores 255 instead of -1 and g_cache.sqroot stores 0 instead of sqroot_adj value.
Check the type of variables using the ptype command.
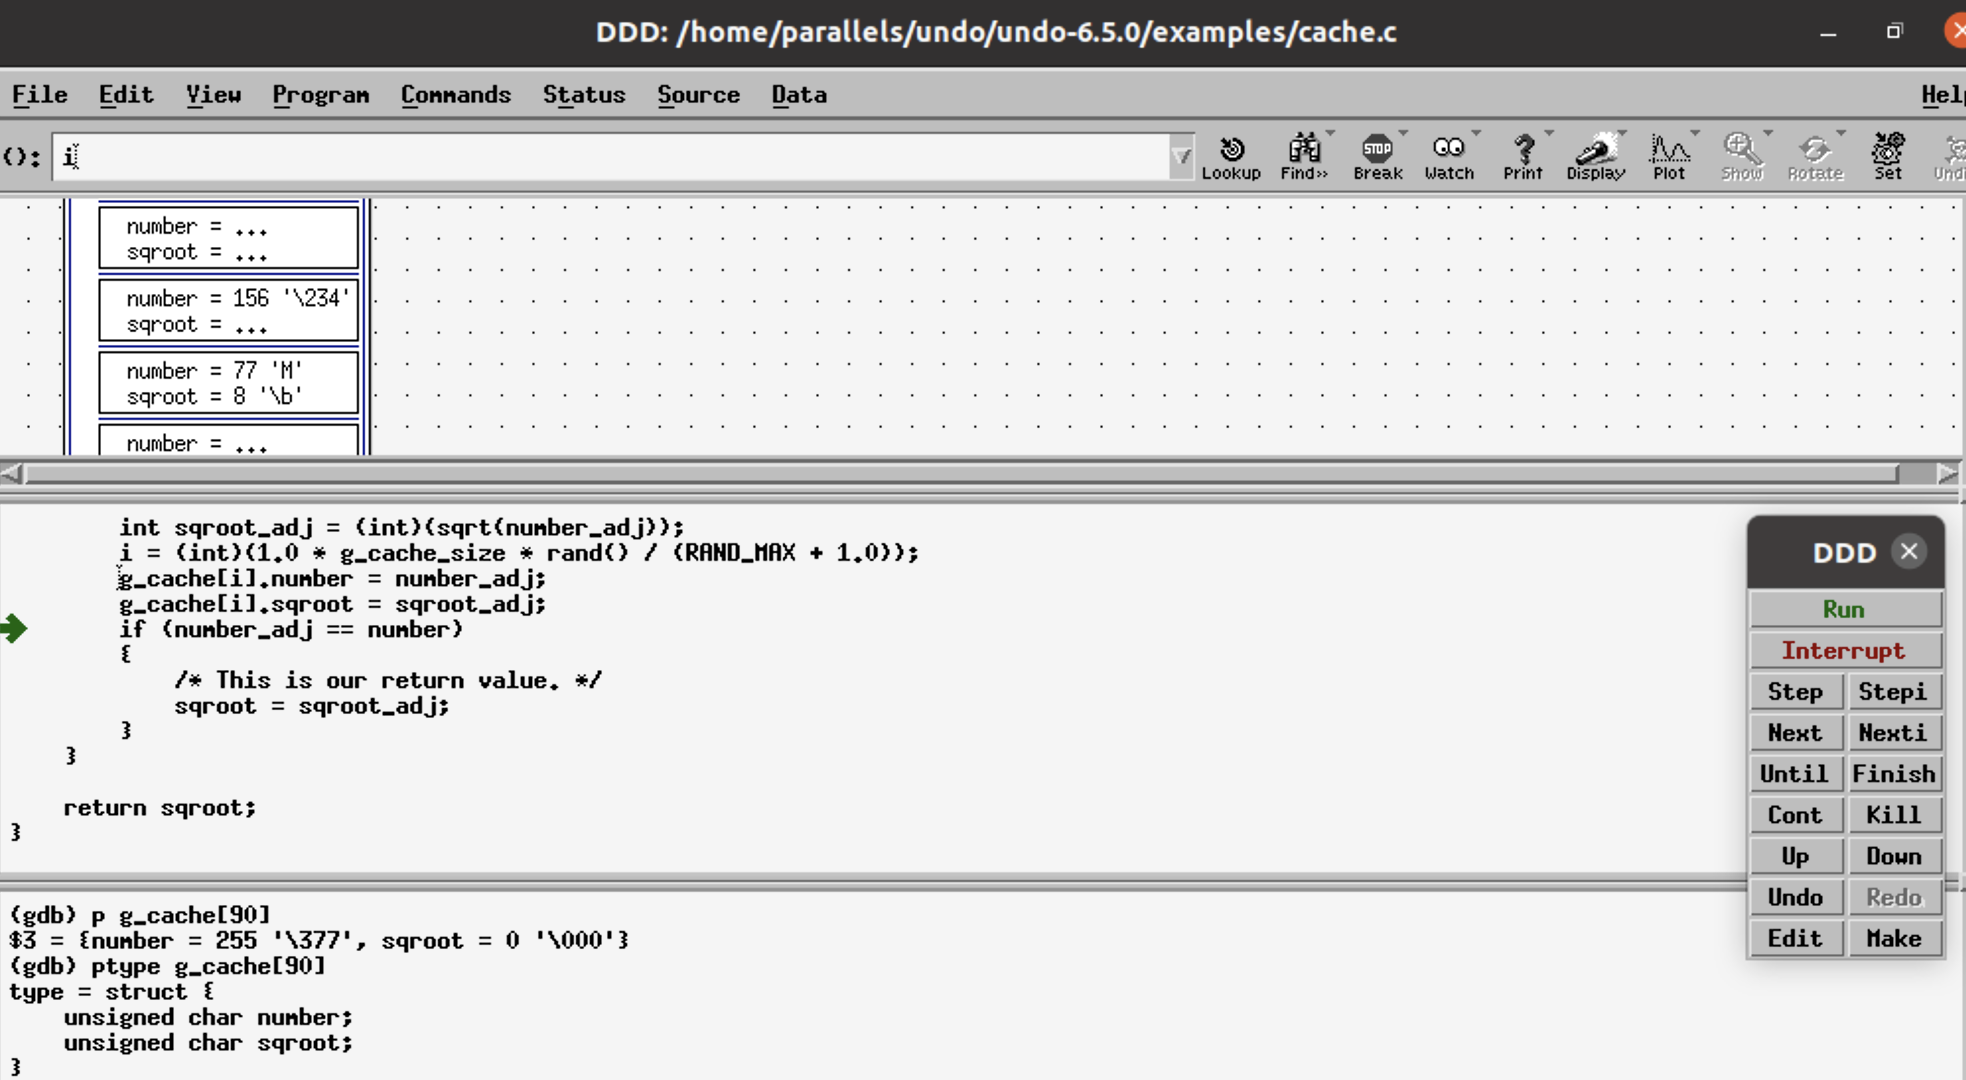
This shows g_cache variables are of the unsigned char type, whereas the number and sqroot_adj variables are of the integer type. [*256 – (Y% 256), where Y is an integer value <0].
The conversion of an int into an unsigned char, assigns the values of g_cache variables as mentioned above, and explains the cache hit for 255 with sqrt value returned as 0!
We have located the bug and the root cause all in a single iteration, thanks to the fact that all of the information (showing what happened as the program ran) is exactly reproduced and viewable. As a result, time travel debugging has led us directly back to the root cause of the problem, in a single deductive process.
You can try UDB time travel debugger out with DDD for yourself on your own application, by downloading a free UDB 60-day trial (desktop software only).
