Resources
Debugging a Data Structure Corruption in SQLite
Time travel debugging offers a number of ways to rapidly analyze and diagnose bugs, even in unfamiliar code. Using the worked analysis of an SQLite issue, we can see how these techniques function in a real-world application.
Firstly, a little background: for anyone who doesn’t know, “SQLite is a C-language library that implements a small, fast, self-contained, high-reliability, full-featured, SQL database engine. SQLite is the most used database engine in the world”. The issue we are looking at was originally detected in the 3.30.0 release of SQLite back in 2019, and revolves around a somewhat cryptic database disk image is malformed error message.
Using LiveRecorder, it was possible to make a recording of SQLite reproducing this error; this was already a significant step to diagnosis, as the recording captured the failure. It was then a question of debugging the recording to locate the root cause of the issue.
The key techniques used to diagnose this issue without any knowledge of the codebase were the following:
- Navigating the execution timeline
- Stepping back into functions returning error codes
- Identifying erroneous data and tracking it back to the source
- Working repeatedly from effect back to cause until the root cause is identified
The full diagnosis is demonstrated in the video above, where you can see the process in detail; but let’s cover the details here at a higher level.
Navigating the execution timeline
The video contains a few examples of navigating the timeline but, basically, as we have a recording of the application’s execution, we need a way to navigate to the interesting points. The first method seen in the video is using the fact that the application outputs data to the console.
We could simply set a breakpoint at the libc write() function and run the recording forward or backward, checking the output buffer every time we stop. There is, however, a faster method, using the recording’s event log, which captures the recording timestamps for every such output stream write, so we can more efficiently jump directly to them. With this approach, we can quickly get to the point in the code where the above error message is output. By looking up the call stack at that point, we can find out why the error message was output. There is also a more advanced feature called Log Jump, which can take you more directly to a specific log line with an accurate timestamp.
Using the method described above, we find where the error message was output. Now we need to find where the error is detected. In some applications it will be as simple as if <error condition> then <output error message> which would be really efficient. Sadly, there is some distance between error detection and output in this case, so we need to continue exploring.
In this case, the error was signalled by an error code return value from the function which tried to execute the SQL command. We could easily have continued unrolling the execution of the application to see where this error was detected, but the video shows a couple of shortcuts to avoid having to step back through the SQL parser and other components. With a code search, we were able to find the actual integrity check function which detected the error. Then, by setting a breakpoint and running the application in reverse, we could confirm it was returning the error code. This shortcut potentially saved us a lot of manual tracing of the SQLite call stack, and only really required an understanding of what the SQL command in question was trying to do.
Stepping back into functions returning error codes
Now that we have a function which is returning an error code, a helpful technique with time travel debugging is simply to reverse into the function in question. A common coding pattern if an error is detected is to signal it somehow and return immediately. Therefore, reversing backwards into the function after it has returned is likely to rapidly get us directly to the point where the error is detected.
We actually find that there is still some separation between where the function returned and the detection of the error, as the returned error code was simply copied from a data structure and returned.
This fortunately only needs another standard time travel debugging technique: we set a watchpoint on the data structure element containing the error code and can then run backward, which will stop us at the point that value was stored. [Watch the magic happen at 12:03 minutes into the video] This takes us straight to the point the error is actually detected in this example.
Identifying erroneous data and tracking it back to the source
It takes a little analysis at this point to deduce what the code is doing and identify what might be going wrong. This is covered in the video, but we essentially identify what appears to be erroneous data in the SQLite table’s data structure, specifically some size and extents values in the metadata. We’ve already seen how we can follow interesting data back to where it came from using the data watchpoint / reverse-continue technique for the error code above, so we can do that again.
This is probably one of the most powerful and useful techniques with time travel debugging, and it is used repeatedly in this example to reach the point where the erroneous data is stored in the table data structure.
Working repeatedly from effect back to cause until the root cause is identified
It takes a few steps, as the SQLite application appears to memcopy() the data structure around a few times. We don’t need to understand why; we can just set a new watchpoint in the source buffer for memcopy() and continue back until we get to the actual write of this bad value into the table. This write is happening inside a function call which is attempting to write an unsigned 16-bit value; but as the original value to be stored was 65547, it doesn’t fit, and the cast causes it to be stored as 11.
We have found where the data corruption came from, but that is not the root cause. SQLite should not be trying to store such values in an unsigned 16-bit data structure element, so we need to find why this was allowed to happen. This means understanding where the 65547 value came from, to see whether there was any range checking and, if so, why it failed.
With yet another data watchpoint on the variable containing 65547, and running backward again, we find the last time it was updated. Here we can see that there was actually a range check performed at that time which appears intended to make sure the data would fit. This range check is verifying that the size value (this 65547 number) was less than 70000, which was inadequate to ensure it would fit in the U16. So let’s use that same watchpoint technique again to see where the 70000 value came from. We find where it was set and see that there is a further range check here, which was checking it against a max size #define constant of 128 kilobytes.
Root cause identified
At this point, we have the root cause, this #define constant allows for the page size in the table data structures to be larger than supported by the U16 values used within. The fix is obvious: we need to change this 128K size limit to 64K, so that the U16 fields are sufficient.
While we have learned a few things along the way about how SQLite works, there was no need for any real knowledge or understanding of the codebase before we started – just a minor understanding of SQL and general knowledge of developing C applications. This shows how powerful time travel debugging is at quickly and efficiently diagnosing problems in an application, even without being an expert in the codebase.
Reproducing this at home
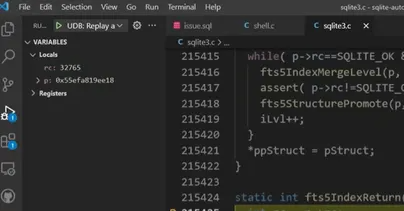
This video demonstrates how to tackle this issue using LiveRecorder to record the application error as it ran, and then diagnose that recording, using UDB to replay it in Visual Studio Code.
UDB is also available as a standalone tool, so it is possible to just run the application under UDB in VS Code directly (which would allow you to reproduce this whole process with just the free trial). There is a very simple additional step which is shown in this YouTube video where you modify the VS Code launch configuration to launch the sqlite3 application and pass the SQL commands in via "args": ["<", "issue.sql"],
Want to try this for yourself? Get the UDB Time Travel Debug VS Code plugin; if you prefer debugging in the command line, get your UDB trial from here.
Author: Chris Croft-White, Engineer at Undo