WatchPoint

5 Easy Ways to Reduce Your Debugging Hours
On the surface, this is a call to keep your code simple, but there is a corollary: debuggability is the limiting factor in software development. Whatever your metric for the “goodness” of your software – performance, features, size, velocity – if you double your effectiveness at debugging you’ll double the “goodness” of your software. Over the last year or so, I shared on the WatchPoint resource center numerous ways to help you increase the pace of your debugging. In this article, I pick five of my favorite GDB topics that I believe can help you spend fewer hours debugging and write better software faster. Let’s dive in. GDB’s command-line isn’t intuitive, but if you spent some time discovering and learning the commands, then you’ll find it very powerful. I guess, one of the least known, but perhaps the most useful things in GDB is TUI mode, i.e. Text User Interface mode. The trouble with the GDB command-line is that it doesn’t give you the context of where you are in the program; for example, if the program hits a breakpoint, then GDB returns you just one line. If you type It’s not all sunshine though. Sometimes the screen messes up a bit but It’s unlikely that the source window alone provides you with all the information you need. Typing These windows are not all visible at the same time. The command window with the GDB prompt and GDB output is always visible. Finally, you’ll notice that the arrow-keys scroll the active window in TUI mode, which means that you can’t use the up and down arrows to get to your previous commands as you normally would do in the GDB command-line. To move through your command history, use A breakpoint lets you stop the execution of the program at a time of your choice. It’s an essential (and I reckon probably the most used) command in your debugging flow. There are different breakpoint types. You set a basic breakpoint with the following command: Where Once your program hits a breakpoint, it waits for instruction. You can navigate or step through the program using A temporary breakpoint only stops the execution of the program once. When the program hits a temporary breakpoint, it deletes automatically, which saves you the trouble of managing and cleaning up obsolete breakpoints. You set a temporary breakpoint with the following command: Tip: Using the Instead of stepping through the execution of the program until it hits the breakpoint again, you can specify a condition for a breakpoint that stops the execution if met. You can write pretty much any condition you want in the programming language of the program that you’re debugging, which makes conditional breakpoints very powerful and efficient. You set a conditional breakpoint with the following command: Here You can make all breakpoint types conditional by adding the suffix, There is more you can do. You can set a condition on an existing breakpoint by using the breakpoint number as a reference. Typing The regex breakpoint command sets an unconditional breakpoint on all functions that match a regular expression (regex) and prints a list of all breakpoints it set. Once set, these breakpoints are treated just like the breakpoints you set with the normal break command. You can delete them, disable them, or make them conditional the same way as any other breakpoint. You set a regex breakpoint with the following command: When debugging C++ programs, In this recording, I cover the various breakpoint types, and how to use each of them in your debugging. GDB has tight integration with Python. You can do all kinds of smart things to help make detecting (and resolving) thorny bugs a breeze. Plus, there are lots of other tricks you can do to customize GDB to your particular project and debugging needs – for example, scripting routine actions, writing your own commands, and creating pretty-printers. Not taking advantage of Python is something you may regret later, a missed opportunity to increase your debugging speed. It’s a small investment in time that pays back quickly and, over time, significantly. You can start small and expand your Python resources over time. A simple way to get started is by invoking the interpreter with typing The Python code isn’t passed to another process but runs inside the GDB process. Python truly integrates with GDB. But to use the Python in GDB properly, you must import the GDB module, which gives you all you need. Switching to TUI mode, you can use the Pretty much anything you can do on the GDB command-line you can do with a breakpoint from Python. You can append commands to a breakpoint, make it conditional, or make the breakpoint specific to a thread. The same is true for most other commands in GDB; if you can do it from the GDB command-line, then you can do it from Python. Tip: Consider making a In this video, I dip into the Python integration with GDB to get you started. If you’ve struggled with imagining what Python can do, this one helps you out. We all use structures and classes in the code we write, and GDB endeavors to display what these are but misses the contextual information; when you use a handful of members, and in particular unions, then interpreting these more complicated structures can get overwhelming. When GDB prints a value, it checks whether there is a pretty-printer registered for that value first. If there is, then GDB uses that pretty-printer to display the value. Otherwise, the value prints in the usual way. In the example below, I didn’t have a pretty-printer for the What do you think? Messy and not easy to read. I promise, creating a simple pretty-printer saves you much time staring at your computer screen. Most pretty-printers comprise of two main elements: To see how this works, let’s write a basic pretty-printer in Python that returns the Now, run any program and hit Much easier to read. Of course, this is just a simple pretty-printer program, but the possibilities are endless. You can extract and print any value of a member in a structure with your pretty-printer. In my video, I show you a quick way to pretty-print structures in GDB and build-out this basic pretty-printer some more. You’ll learn that it isn’t difficult to extrapolate this handy printer to display whatever structure you want. To quote Kernighan once more: Debugging involves backward reasoning, like solving murder mysteries. Something impossible occurred, and the only solid information is that it really did occur. So we must think backward from the result to discover the reasons. Or in other words, we really want the debugger to be able to tell us what happened in the past – reality has diverged from your expectations, and debugging means figuring out at what point your expectations and reality diverged. You need to know what your program actually did as opposed to what you expected it was going to do. This is why debugging typically involves reproducing the bug many times, slowly teasing out more and more information until you pin it down. Reversible debugging takes away all that guesswork and trial and error; the debugger can tell you directly what just happened. Not everyone knows about it, but GDB has built-in reversible debugging since release 7.0 (2009). It works pretty well, but you’ve to be ready to sacrifice performance (a lot of it); it’s dramatically slower than any of the purpose-built time-travel debuggers out there like UDB. But it’s built right in, so why not use it? Type You can use reverse commands to go backward, for example: The challenge is that in most cases, you can’t predict when the program faults, which means that you may have to run (and record) the program repeatedly until it eventually stalls. Some GDB commands can help you out here. Breakpoints and watchpoints work in reverse, which can help you, for example, to continue directly to a previous point in the program at which specific variable changes. Reverse watchpoints can be incredibly powerful. I know of several instances of bugs that alluded a developer for months or even years that were solved in a few hours with the power of reverse watchpoints. Another cool GDB thing is that you can trigger a command (or series of commands) when the program hits a breakpoint. Type In this video, I demonstrate live on stage reversible-debugging in GDB. Check it out, it shows you step-by-step (in reverse) how to trace a fault in my program. UDB Time Travel Debugger That’s it. I shared five easy ways to reduce your debugging hours. Perhaps a little overwhelming now, but the good news is that you don’t have to adopt all at once. That probably would have the opposite effect. Sometimes little tweaks to your usual debugging habits and routines can already make a big difference. Just start with small steps. Take your time to read the different tutorials and watch the videos that I shared in this article and adopt the things that you feel can improve your debugging. And, make sure to share your takeaways with your project members and organization so everyone benefits.Introduction
1. GDB TUI Mode
Ctrl-x-a (or tui enable), then another text window opens; the source window shows the source file of the program, as well as the current line and the breakpoints. You’re now in GDB’s TUI mode.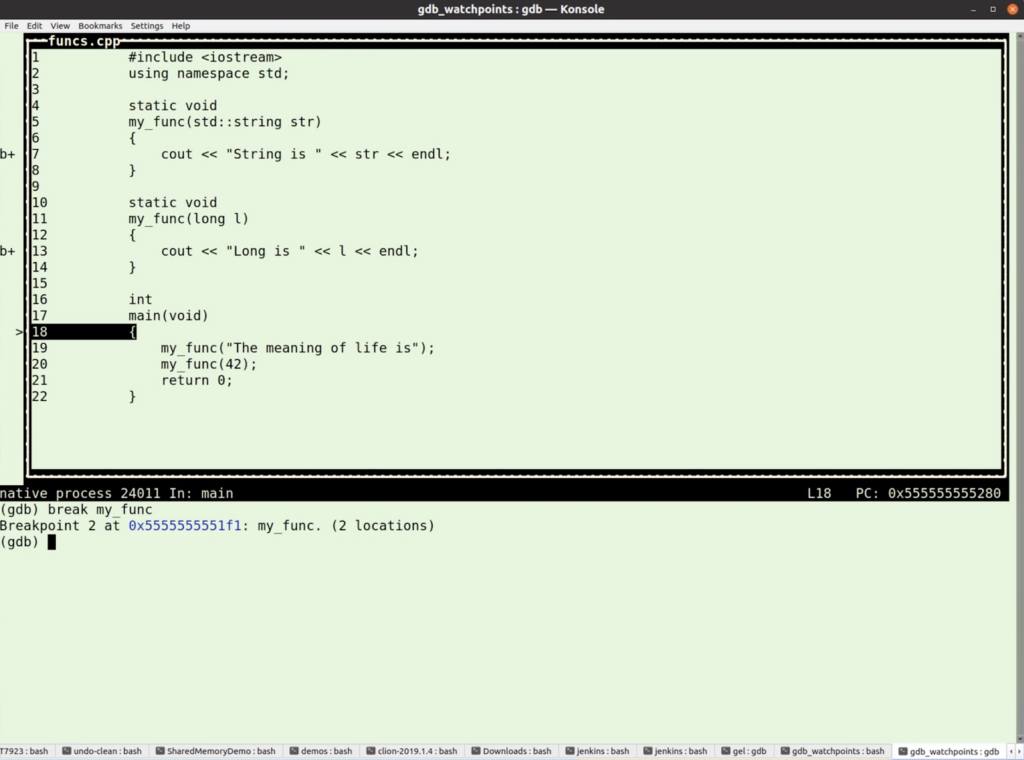
Ctrl-l refreshes the screen.Ctrl-x-2 helps you cycle through different text windows and layouts:
Ctrl-x-1 returns the layout to the command window with the source or assembly pane.Ctrl-p (previous command) and Ctrl-n (next command) instead; Ctrl-b and Crtl-f respectively to move the cursor back (left) and forwards (right) to edit the line.
2. GDB Breakpoint Types
Basic breakpoints
break [LOCATION] or just b [LOCATION]LOCATION can be a line number, function name, or “*” and an address.(gdb) break hello.c:7
next, continue, step i, and other commands. To speed up your typing, you can abbreviate all of these commands; n for next, c for continue, si for step i – you get it.Temporary breakpoints
tbreak [LOCATION](gdb) tbreak main
start command instead of the usual run command sets a temporary breakpoint at main().Conditional breakpoints
break [LOCATION] if [CONDITION][CONDITION] is a boolean expression, which, in GDB, is TRUE if the result is nonzero; otherwise, it is FALSE. The condition can include a function call, the value of a variable, or the result of any GDB expression.(gdb) break my_func if i==5
if [CONDITION].condition [BREAKPOINT #] [CONDITION](gdb) condition 2 i==5
condition [BREAKPOINT #] removes the condition from a breakpoint.REGEX breakpoints
rbreak REGEXP(gdb) rbreak hello.c::my_func*
rbreak is particularly useful for setting breakpoints on overloaded functions that are not members of any special classes.rbreak saves you a lot of time typing and trying to remember exact function names.3. GDB’s tight integration with Python
python. You can now use any Python code, for example, typing print('Hello World'), followed by typing end calls the python print() function.(gdb) python import gdb
.execute command to create a breakpoint, or even better, create an object instance of gdb.breakpoint. We now can manipulate and interrogate this object, enable or disable it, etc.gdbinit per project, and committing it into your project’s source control so that everyone working on that project can benefit.4. GDB Pretty-Printers
siginfo_t structure, which caused the print info command to return all the data in the structure, including expanding the unions it uses.
si_signo value from the siginfo_t structure for an interrupt signal that the program receives.# Start off with defining the printer as a Python object.
class SiginfoPrinter:
# The constructor takes the value and stores it for later.
def _init_(self, val):
self.val = val
# The to_string method returns the value of the
# si_signo attribute of the directory.
def to_string(self):
signo = self.val[‘si_signo’]
return str(signo)
# Next, define the lookup function that returns the
# printer object when it receives a siginfo_t.
# The function takes the GDB value-type, which, in
# our example is used to look for the siginfo_t.
def my_pp_func(val):
if str(val.type)==‘siginfo_t’: return SiginfoPrinter(val)
# Finally, append the pretty-printer as object/ function to
# the list of registered GDB printers.
gdb.pretty_printers.append(my_pp_func)
# Our pretty-printer is now available when we debug
# the inferior program in GDB.
Ctrl-c to quit. The pretty-printer returns the value 2; the value for a SIGINT.(gdb) source prettyprint.py
(gdb) print info
$4 = 2
(gdb)
5. Reversible Debugging
record to start reversible-debugging.(gdb) record
reverse-next (rn) – step the program backward, run through subroutine callsreverse-nexti (rni) – step backward one instruction, but run through called subroutinesreverse-step (rs) – step the program backward until it reaches the beginning of a previous source linereverse-step (rsi) – step backward one instructionreverse-continue (rc) – continue the program but run it in reversereverse-finish (rf) – execute the program backward until just before the point the memory changescommand [breakpoint #], where [breakpoint #] is the identifier for your breakpoint.command 1
Type commands for breakpoint(s) 1, one per line.
End with a line saying just "end".
record
continue
end
Step backwards in time in your program to view registers and memory with a Time Travel Debugger
Learn more »
Want debugging tips directly in your inbox?
Share this tutorial