Resources
Palo Alto Networks resolve a long-standing firewall defect in 15 minutes

Some context
Palo Alto Networks is a global cybersecurity leader providing network security, cloud security, and AI-powered security operations to enterprises worldwide.
At Palo Alto Networks (PAN), quality is paramount. In their complex, large-scale deployments, issues occasionally surface in the field, and PAN prioritizes resolving them quickly.
When a process crashes, the engineering team typically receives a customer ticket with a backtrace and sometimes a core file. Without Undo, these types of investigations often took around 3 weeks to resolve.
A few years ago, Palo Alto Networks integrated Undo into its debugging workflow to accelerate root cause analysis of complex issues affecting customer-deployed firewall products. MTTR fell from 3 weeks to just 1 or 2 days, dramatically improving engineering productivity.
Today, Undo’s new AI capability cuts that investigation time from 1 or 2 days to just 15 minutes.
Learn how Palo Alto Networks engineer Harshith K used Undo AI to automate root cause analysis of a double-free memory corruption bug — 100x faster than traditional debugging methods.
Before Undo AI was introduced, I would have taken 1 to 2 days to debug things. With it, we got the exact root cause in 15 minutes.
Harshith K, Software Engineer at Palo Alto Networks
The challenge: a bug that defied 3 previous attempts
A customer reported a process crash on a PAN firewall. The bug had been reported several times before, but the team had been unable to resolve it because they could not reliably reproduce it.
The crash was caused by a double-free memory corruption issue: a process was attempting to free the same block of memory twice, causing it to crash. Although the team had a backtrace, these bugs are notoriously difficult to diagnose because a backtrace shows where a process crashed, not the sequence of events that led to the crash.
The challenge was determining which execution path led into the error-handling logic. A function contains multiple conditional branches, each capable of routing execution into an error-handling block. That error block in turn calls further functions. From a backtrace, you can see the call chain, but you cannot tell which of the several conditions triggered the error path in the first place. Even with GDB, the team could not determine which configuration state triggered the failure.
The team suspected a corner case in the configuration parsing logic. This time, however, the customer could reliably reproduce the crash by following a specific sequence of steps, creating an opportunity for a full investigation.
The 5-step solution
STEP 1: Bug received and assessed
Harshith reviewed the backtrace from the customer ticket. Recognizing the pattern from previous reports, he decided to pursue a recording-based approach now that a repro was possible.
STEP 2: TAC team coached and recording taken
The Technical Assistance Center (TAC) engineer assigned to the customer hadn’t used Undo before. Harshith spent around one hour coaching him using Undo’s existing documentation. The process was straightforward: they attached Undo’s LiveRecorder tool to the specific crashing process, the customer followed the steps to trigger the issue, and the recording was captured automatically. Capturing the recording took just 3–4 minutes. Due to time zone differences, it was ready for Harshith the following morning.
STEP 3: First AI query: finding the crash
With the recording in hand — and source code and symbols provided — Harshith used Undo’s AI capability to connect to Claude and asked: “Find why this process is crashing.” The AI navigated the full recording autonomously (treating it like an interactive debugging session) and queried through the history to retrieve the control flow and data flow of individual functions. Within 7.5 minutes, it had identified which function was leading to the crash and provided a strong indication of the root cause, but the exact trigger still needed pinning down.
STEP 4: Follow-up query to pinpoint the root cause
The first query showed where the crash occurred, but not what had triggered the jump into the error block, the critical missing piece that a backtrace alone can’t answer. Harshith directed the AI towards the configuration parsing logic and asked a targeted follow-up. The AI traced the conditional path through the relevant code, examined the config values present at the time of execution, and identified the exact root cause: a specific corner-case configuration state that caused the process to enter the error block incorrectly, resulting in the double-free. It identified both where the first and second free occurred.
STEP 5: Workaround delivered, proper fix to follow
Harshith provided the customer with a workaround to unblock them immediately. The fix was later confirmed and committed with no further issues.
The results
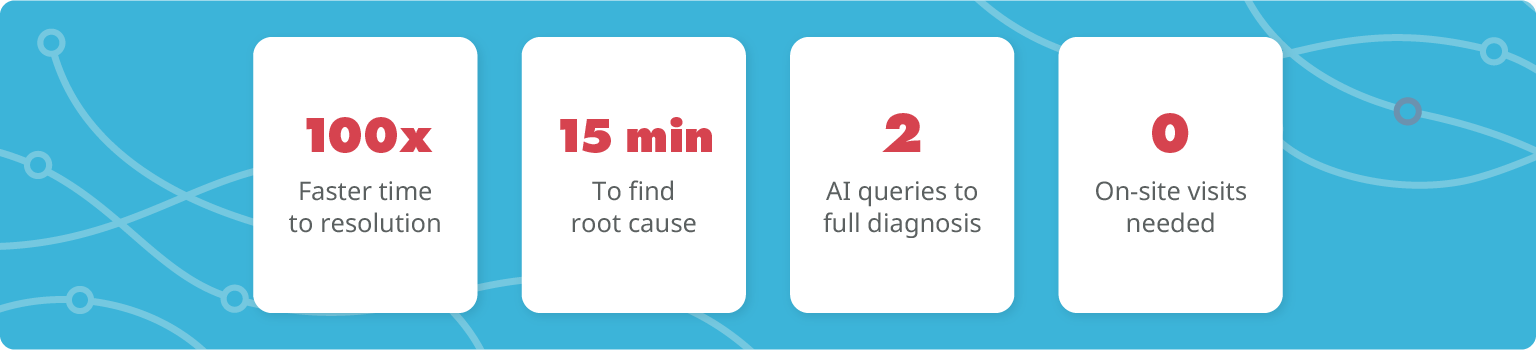
100x faster root cause analysis
A long-standing bug was fully diagnosed in just 15 minutes (down from an estimated 3 weeks without Undo).
| Approach | MTTR | Speed-up |
| Without Undo (traditional debugging) | ~ 3 weeks | Baseline |
| With Undo (time travel debugging) | 1 – 2 days | ~ 10x faster |
| With Undo AI (automated RCA) | 15 minutes | ~ 100x faster than baseline |
Customer unblocked quickly
A workaround was provided immediately, allowing the customer to continue operating normally while a proper fix was prepared and committed.
No onsite visit required
The recording was taken entirely remotely, during a call with the customer. No travel, no access issues.
Repeatable process and low barrier to entry
A TAC engineer with no prior Undo experience was up and running in around an hour, using existing documentation and brief coaching.