Resources
How to Debug Multiple Processes Communicating with Sockets in C/C++
When debugging multiple processes, it’s really hard to trace the information that flows from one process to another process.
If you use a lot of Inter Process Communication (IPC), each layer of communication means another layer through which you have to jump from one process to another.
But fear not! In this video, Software Engineer Magne Hov illustrates how you can use Undo recordings and UDB’s socket correlation features to easily track information as it flows between different processes.
There’s no need to manually track down and correlate the communication anymore, saving you extra engineering effort and allowing you to get to the necessary point in the codebase within minutes.
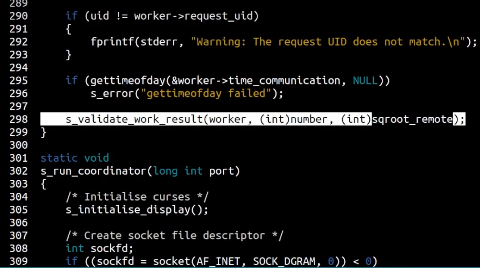
The video shows a program called run-cache-distributed. This is a simple bash script which spawns a number of worker processes to perform calculations in parallel, and a coordinator process to assemble the results of the calculations.
The process is recorded using this command:
$ undo record --quiet --record-on program:cache* ./run-cache-distributed
The --quiet argument prevents any output from undo record.
The --record-on program: argument specifies which processes in the process tree are to be recorded. In this case, it will record the cache-worker and cache-coordinator processes, but not the top-level run-cache-distributed script.
Once started, the terminal shows each worker process’s IP address and port, its work rate and its most recent calculation. After the process runs for a while, the coordinator detects an invalid result and terminates. We can see that a number of recordings have been created in the current directory. We can start debugging the coordinator using:
$ undo debug cache-coordinator-xxx.undo
This would be enough to debug the coordinator process in the usual way, but we can add information about the worker recordings too:
> uload --correlate-directory .
This searches for any relevant recordings in the current directory. The recordings are not loaded immediately.
To debug, we go to the end of the recording where the coordinator aborts, and work backwards to find where the bad data was received. This takes us back to a call to recvfrom. Normally the trail would go cold at this point, but instead we can issue:
> ugo sender
This finds the corresponding send in one of the worker recordings, loads that recording and goes to the appropriate time – we see that there is a sendto call at that point. From there we can continue tracing the origin of the data backward in the worker process, until the root cause is reached.
Would you like to see how this could work on your multiprocess application? Feel free to book a demo with one of our engineers, or try Undo for free.