Resources
Finding the root cause of complex bugs with reverse debugging
A difficult-to-find bug can be quite easily traced back to its root cause by using a reverse debugger.
The biggest challenge of debugging is often trying to figure out what led to a certain situation and clearly, the further the cause of a problem is removed from how it manifests itself, the more difficult it is to understand. The following example session is a stripped down version of something that could have appeared in an embedded environment, the complete listing is at the end of this post.
Bugs and complex, real-time software
So you worked on this huge pile of C/C++ code on Linux and it is time to ship. Only – occasionally it doesn’t quite work OK, but that is just a minor issue that you will iron out really quickly… and ship on time, right? Consider some kind of real-time consumer that processes data (in this case assumed to be a device). It is a bit demanding and might need to have some of its parameters tuned in order to make it operational, but some times a simple retry will do – so you make it retry its initialisation but after a certain period you want to try it with different parameters. After successful initialisation, the device consumes some data (here illustrated with the factorials it is being fed).
The error and existing methods of finding it
The bug itself is not easily reproducible, with the device often starting OK for weeks, then all of a sudden some of the input data seem wrong, making your device misbehave (for this example on my machine it happens about 1 in 1000 runs). You add a printf() to have a look at the input data (lines 85/86) and it is indeed completely off. You unit test your factorial function but that seems OK. So, where in your 100kLOC application is the part that goes wrong? You already ruled out the device itself, because the error shows up in the interface function without the device itself being actually used (stubbing out the interfacing functions will have taken at least an hour or two… if you are lucky!). Perhaps it is bad memory; should you retry on different hardware next?
As you can probably imagine, this issue will become much more difficult to solve, if the wrong values cause some very subtle changes, possibly only much later in the run.
Witness the power of reverse debugging
Wouldn’t it be very convenient to set a breakpoint at where we are sure an error has been detected, and just go backwards from there, having a look at what led to this? Essentially you’d be able to record, rewind and replay your code to find (and then fix) the bug. You can travel back in time in your program’s execution (that’s why it’s often called Time Travel Debugging).
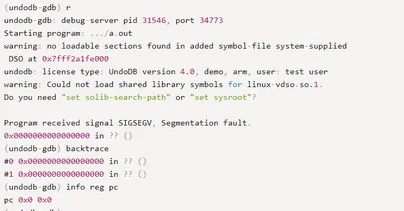
In one of the next blog posts , we’ll show you how to script this neatly. But for the moment let’s assume we were running the debuggee inside UDB (formerly known as UndoDB) and on this run the issue that we are interested in occurred. We will find ourselves at the end of the program’s execution:
Program received signal SIGSTOP, Stopped (signal).
undodb-gdb: The program has exited, but is still being debugged.
undodb-gdb: (You may use undodb commands to go backwards.)
0x00007f55d0b5dc19 in __GI__exit (status=status@entry=0) at ../sysdeps/unix/sysv/linux/_exit.c:32
32 INLINE_SYSCALL (exit_group, 1, status);
(undodb-gdb)
Now, to get closer to the error manifestation, let’s set a breakpoint at the place where we detected it has gone wrong and let the program run backwards:
(undodb-gdb) break example.c:86
Breakpoint 3 at 0x400a62: file example.c, line 86.
(undodb-gdb) reverse-continue

Continuing.

Breakpoint 3, main () at example.c:86
86                      printf ("the factorial of %u is: %zu\n", m, q);
(undodb-gdb)
indeed:
(undodb-gdb) print m
$1 = 5
(undodb-gdb) print q
$2 = 515396071800
(undodb-gdb) call factorial (m)
$3 = 120
Now, we are continuing to execute the program backwards and step into factorial. (Remember that the line that is printed is the line that will be executed next):
(undodb-gdb) reverse-next
85                  if (q > 362880)
(undodb-gdb) reverse-step
37      }
(undodb-gdb) reverse-step
36          return ret;
(undodb-gdb) reverse-step
32          while (m > 0) {
and unsurprisingly ret is wrong:
(undodb-gdb) print m
$8 = 0
(undodb-gdb) print ret
$9 = 515396071800
ret being the factorial of a number < 10, it should never be larger than factorial (9) = 362880, as we already know. Let’s use that for a conditional watchpoint (going backwards, so we are interested in when it becomes ok again):
(undodb-gdb) watch ret if ret < 362880
Hardware watchpoint 7: ret
(undodb-gdb) reverse-continue
Continuing.
Hardware watchpoint 7: ret

Old value = 4294967265
New value = 24
factorial (m=5) at example.c:30
30          size_t ret = 1;

(undodb-gdb) print m
$10 = 5
(undodb-gdb) print ret
$11 = 24
If the watchpoint fired here, that means going back one more step will show us where the bad thing happened, right?
(undodb-gdb) reverse-step
29      {
(undodb-gdb) reverse-step
84                  size_t q = factorial (m);
That seems odd.. we are back in main and there is nothing suspicious? Well, this is the last time the function was called where ret was OK, which is not quite what we wanted. The debugger tries to be clever and only enables the watchpoint where the variable is actually in scope. We need to watch the address itself if we want it to trip on every write access, but let’s step back into the function first (as you can see, you can rewind and replay the program, running it forwards and backwards and explore as much as you like):
(undodb-gdb) step
factorial (m=5) at example.c:30
30          size_t ret = 1;
(undodb-gdb) step
32          while (m > 0) {
(undodb-gdb) print &ret
$14 = (size_t *) 0x7fff799e4698
(undodb-gdb) watch *(size_t *) 0x7fff799e4698
Hardware watchpoint 8: *(size_t *) 0x7fff799e4698

(undodb-gdb) continue
Continuing.
[Switching to Thread 13229.13254]
Hardware watchpoint 15: *(size_t *) 0x7fff799e4698

Old value = 1
New value = 0
0x0000000000400843 in timeout_fn (val=...) at example.c:22
22          *((unsigned *) val.sival_ptr) -= 1
Wait a moment – our timeout_fn() is writing to this, causing an underflow? But the timer is being deleted in line 66…? That is correct, but the man page of timer_delete() actually warns that “The treatment of any pending signal generated by the deleted timer is unspecified.†– and even though this example is using threads instead of signals, that seems to be exactly what is going wrong: later invocations of the timer_fn() will try to change the value of init_param that was passed by address during setup(), only setup() has returned since and therefore the pointer to it is invalid (C99 standard, section 6.2.4) and was in this particular case pointing to local variables for the function factorial().
This debugging session has taken just a couple of minutes, whereas – as people who spend time debugging similar issues know – other approaches can take weeks. So you’ve reduced your debugging time and shipped quality C/C++ code on time, thanks to reverse debugging.
The code:
#include <;assert.h>;
#include <;stdio.h>;
#include <;signal.h>;
#include <;time.h>;
#include <;stdbool.h>;
#include <;stdlib.h>;
#include <;unistd.h>;


// succeeds randomly
bool device_initialised (unsigned param, unsigned other_params)
{
    (void) param; (void) other_params;// just for illustration purposes
    return (random() > (RAND_MAX>>1));
}


// adjust parameters on timeout
void timeout_fn (union sigval val)
{
    *((unsigned *) val.sival_ptr) -= 1;
}


// a function that calculates something
size_t factorial (unsigned m)
{
    size_t ret = 1;

    while (m > 0) {
        ret *= m--;
    }

    return ret;
}


int setup ()
{
    unsigned init_param = 10, other_params = 0;
    timer_t timer_id;

    struct sigevent se = {
        .sigev_notify = SIGEV_THREAD,
        .sigev_value.sival_ptr = (void *)&init_param,
        .sigev_notify_function = &timeout_fn
    };

06]

    struct timespec max_wait = { .tv_nsec = 10000 };
    struct itimerspec timeout_settings = { max_wait, max_wait };
    assert (!timer_create (CLOCK_MONOTONIC, &se, &timer_id));
    assert (!timer_settime (timer_id, 0, &timeout_settings, NULL));

    while (init_param && !device_initialised (init_param, other_params))
        other_params++; // tune other parameters for device

    if (!init_param) {
        fprintf (stderr, "the frobulator does not work - initialisation failed!\n");
        return -1;
    }

    fprintf (stderr, "frobulator is happy, proceed...\n");
    assert (!timer_delete (timer_id));
    return 0;
}


int main ()
{
    unsigned m, n=10000;

    if (setup ()) {
        fprintf (stderr, "setup failed\n");
        return -1;
    }

    // device consumes data
    while (n--) {
        for (m=0; m<10; m++) {
            size_t q = factorial (m);
            if (q > 362880)
                printf ("the factorial of %u is: %zu\n", m, q);
        }
    }

    return 0;
}