WatchPoint

Debugging multithreaded programs in GDB
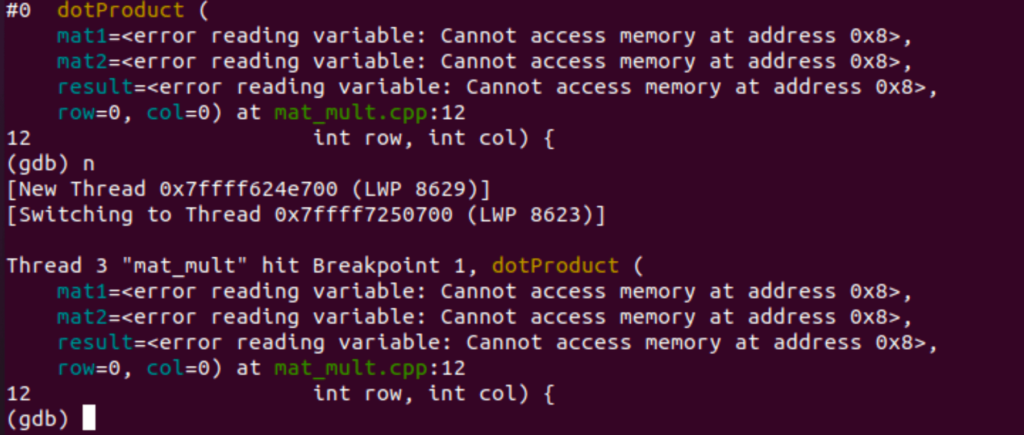
In this episode, our guest contributor is Satabdi Das, Software Development Engineer at AWS. Satabdi is an expert at developing and debugging complex software systems in C++. She is also a speaker at C++ community events. Over to her! In this tutorial, I am going to show you a few GDB commands for debugging multi-threaded programs. Running GDB on C++ programs with multiple threads is difficult, but these commands are going to give you some visibility into the state of your program and help you debug multi-threaded programs. When I run a multi-threaded program on GDB, I’d like to see the thread information. I am going to use the following commands to get the information about the existing threads: And the output is going to look like the following: The star to the left of thread number 2 indicates that this is the current thread. I haven’t specified any arguments to this command. So it displays information about all the threads. You can specify the list of threads that you want to see. For example, I can get information for threads 1 and 2 using the command Sometimes I want to switch between threads and check what a specific thread is doing. I am going to use the command Let’s execute the next line on GDB. Note that gdb switched to a different thread. This can be annoying when you want to trace the execution for a particular thread. You can use the command
Next, I am going to set a thread-specific breakpoint. I am going to set a breakpoint on line 16 for the current thread using the command Since I have set the breakpoint only for this thread, GDB is not switching between threads. The last command I am going to show you is to apply a certain command to a group of threads. For example, I want to print the backtrace of all the threads and I am going to use the command That’s all I wanted to share with you in this tutorial. Hope you’ve learnt something new about GDB today.How to get thread info in GDB
info threads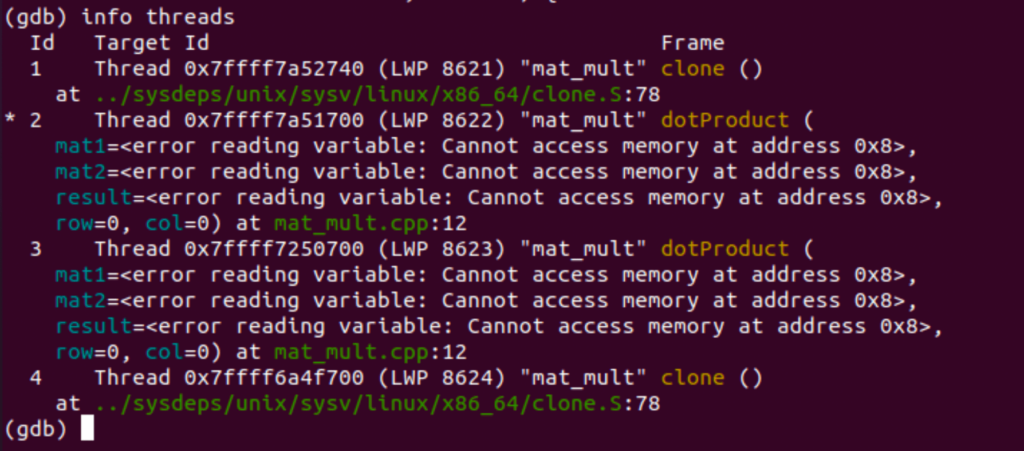
info threads 1 2 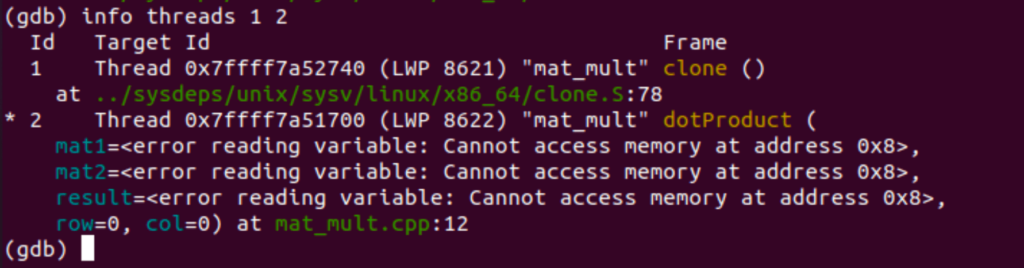
How to switch thread in GDB
thread 1 to switch to thread number 1.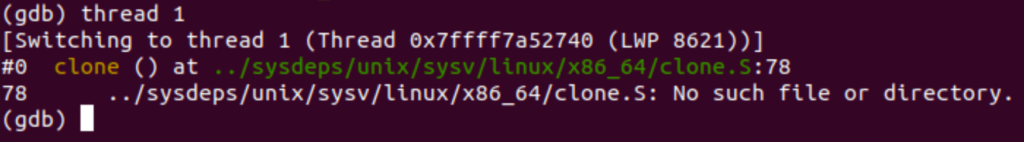
set scheduler-locking on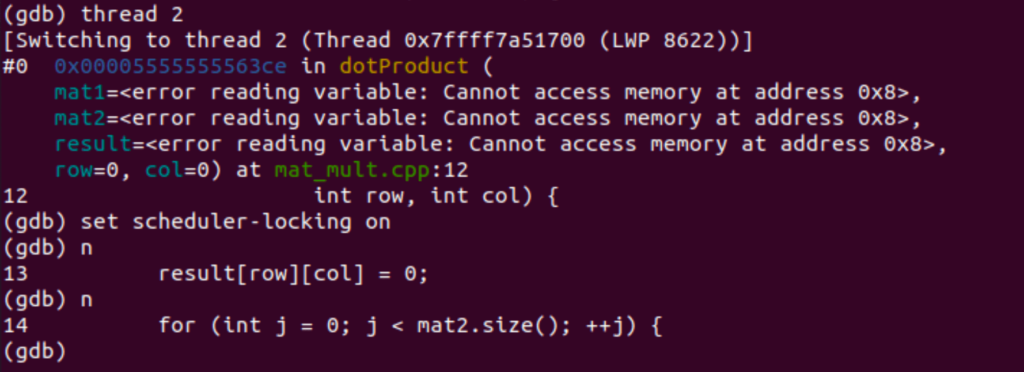
Setting a breakpoint in GDB
b 16 thread 4.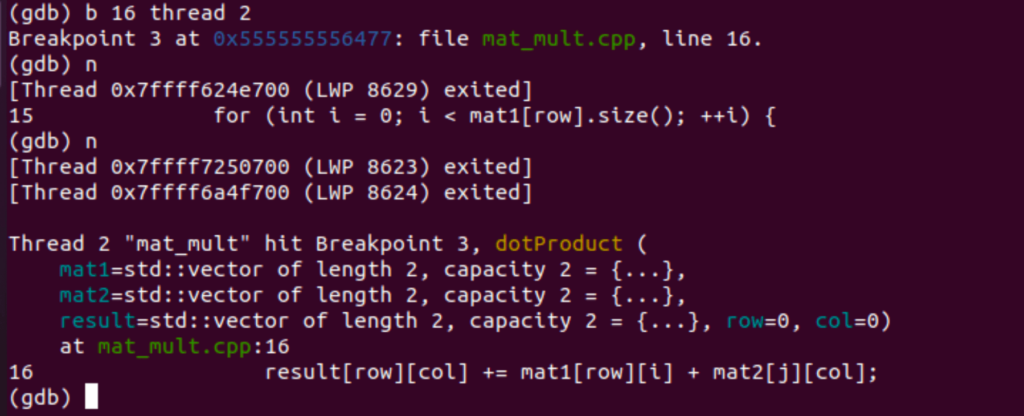
Using GDB Thread Apply All bt
thread apply all bt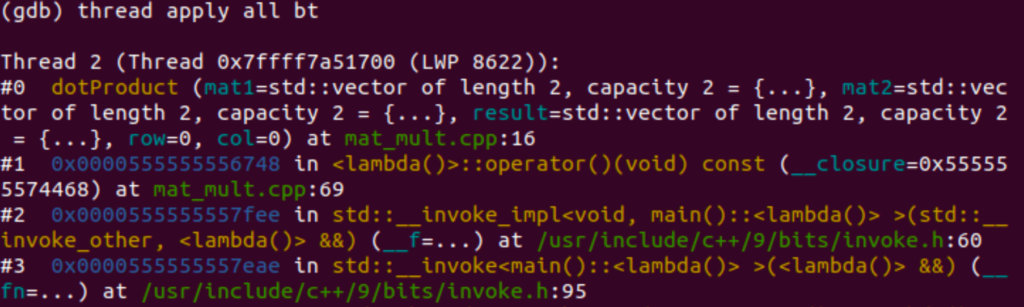

Want debugging tips directly in your inbox?
Share this tutorial