WatchPoint

How to use the GDB command hook?
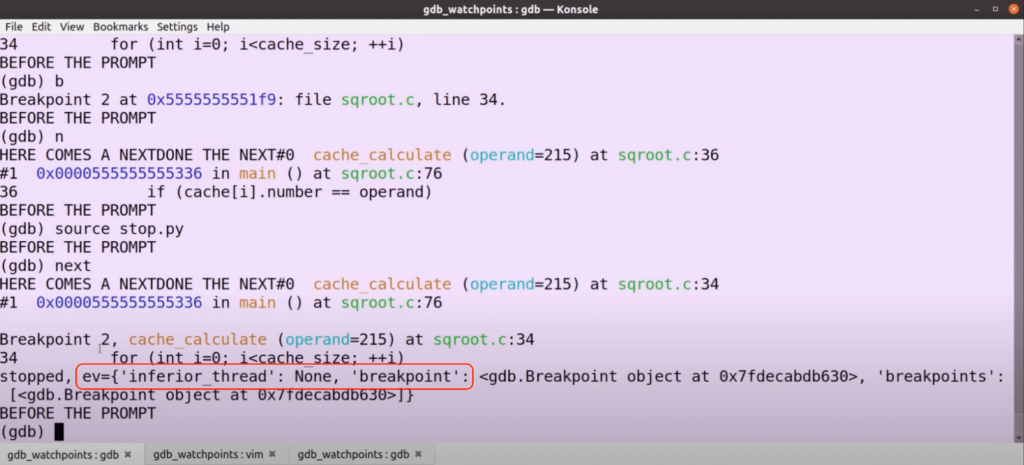
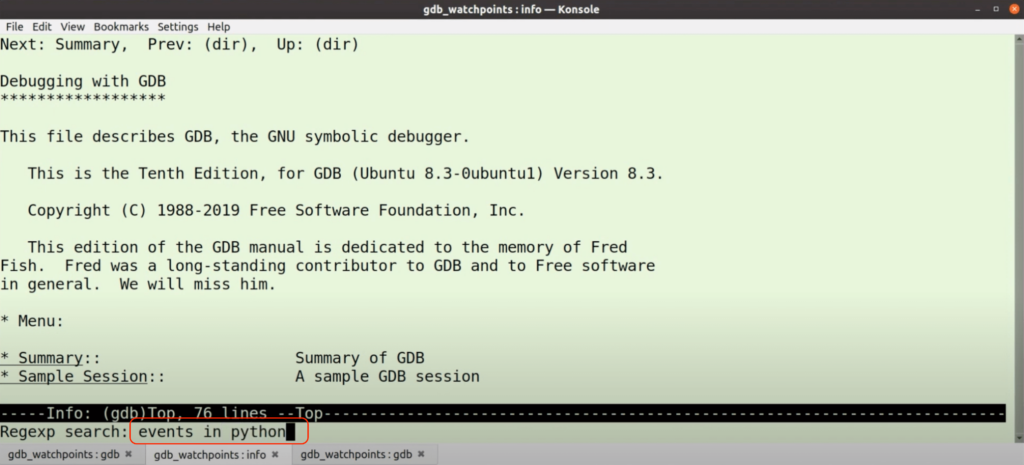
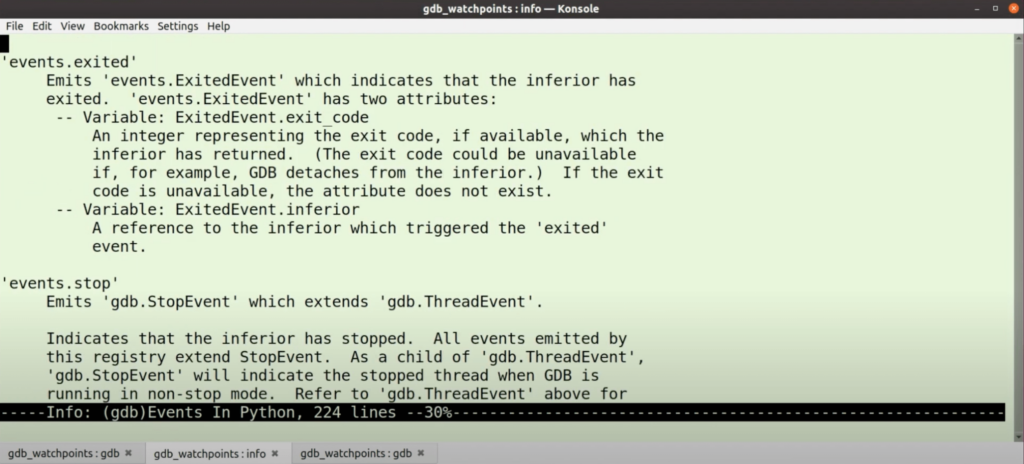
In the last two GDB tutorials, we looked at user-defined functions, both in the GDB command-line and in Python. In this GDB article, we look at defining hooks, a handy variant of a user-defined GDB command. Again, we’ll do both in the command-line and Python. Let’s start your program the usual way. In the command-line, we specify a user-defined command just like before, but only this time we start it with Whatever comes after the dash is the command that we hook. In the example above, every time we do a We can do a post-hook with a There’s a pseudo command that we can hook called For example, let’s go to a The advantage of using GDB command Let’s see how we do that. UDB Time Travel Debugger The equivalent of Note that the syntax is If we now There are a whole bunch of other events though that we can hook to. For example, let’s do the equivalent of the Unlike the Notice that it will reconnect every time we run this; you can connect functions multiple times. We hit an event. It is an inferior thread which has a breakpoint associated with it. So, we can see this breakpoint number two. If we disable breakpoints and continue to the end of the program, then we reach a different kind of stop. We hit an abort, and we can see that we were stopped due to a There are many events that a program can stop on. You can stop at an You can look up an extensive list of events that are available in GDB in the info page in the usual way. How to do that again? Though, the trouble with these info pages is that you need to know what to look for. Let’s search for “events in python”. This gives you a whole chapter of all the things we just went through in this GDB tutorial, including all the different events; pretty extensive, pretty powerful. I hope you do recognise how you might do a lot of cool stuff with that. That’s hooks! Don’t forget to watch, subscribe, like, and share my video. Good luck debugging. In this GDB Tutorial
Hooks in the GDB command-line
hook- (hook dash).(gdb) define hook-next
>echo HERE COMES A NEXT
>end
(gdb)
next, it prints “HERE COMES A NEXT” before the command runs.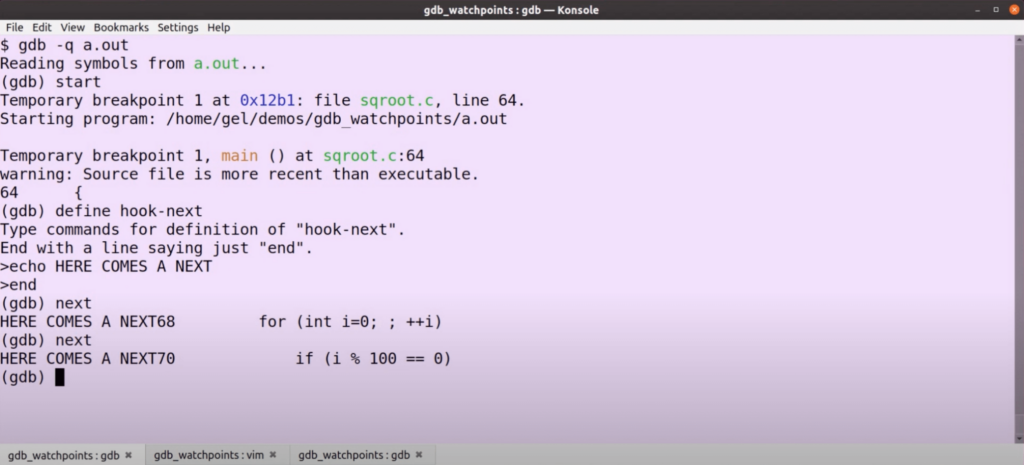
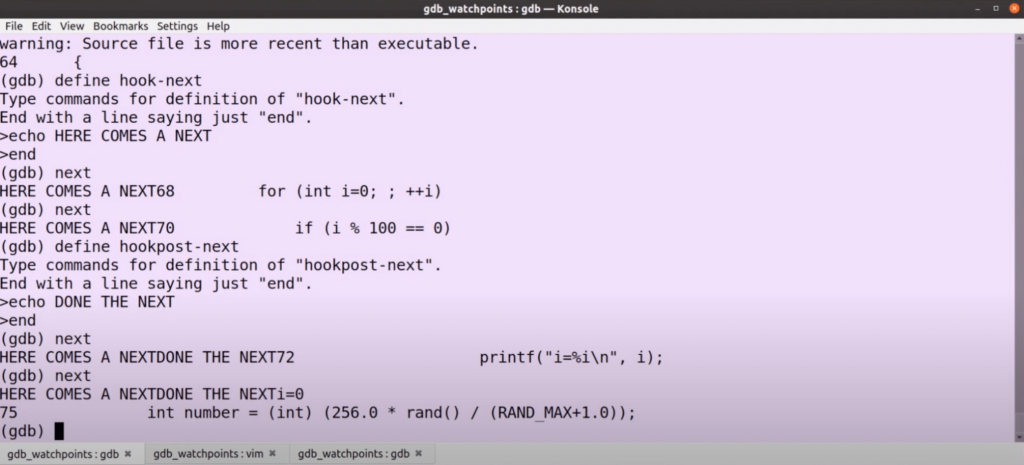
hookpost to do something after the command happens.(gdb) define hookpost-next
>echo DONE THE NEXT
>end
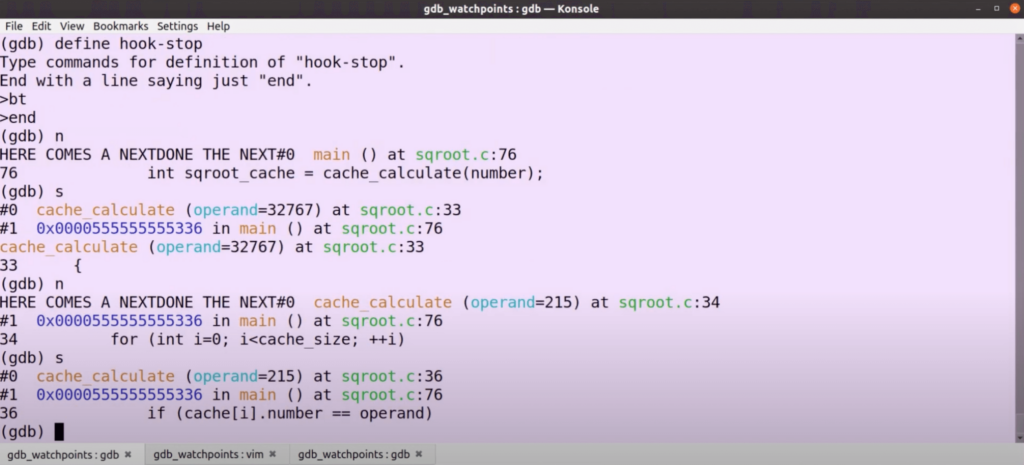
stop. That’s a very useful command because every time the inferior stops we go back to the GDB-prompt, and we can run something.backtrace or bt each time we step into the program.(gdb) hook-stop
>backtrace
>end
hook in the command-line is that you can do them very quick and dirty. And it is pretty easy to remember syntax too, which is nice. But if you want to do something a bit more meaningful and want to check it into source control, you probably want to do that in Python.
Find and fix bugs in minutes – save time on debugging
Learn more »GDB hooks in Python
stop in a way is that we can hook the prompt. Again, it’s a simple syntax. The only thing we need is a function.$ vim stop.py
def foo():
   print("BEFORE THE PROMPT")
gdb.events.before_prompt.connect(foo)
connect, not hook.source stop.py, then it prints the text “BEFORE THE PROMPT” as we do expect it before every prompt.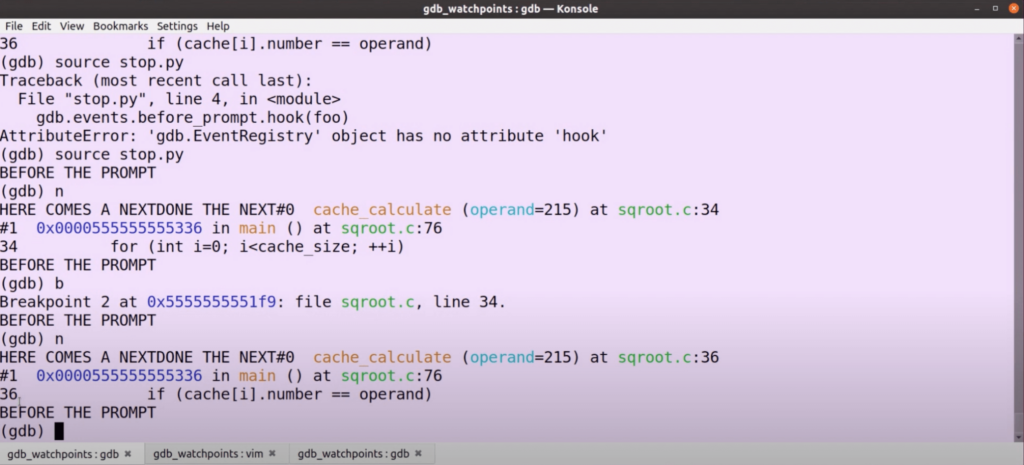
stop we were just doing in the command-line, but this time in Python.before_prompt command, other commands expect an event-argument which you can look up to tell why the program stopped.def stop(ev):
print("stopped, ev={}.format(ev.__dict__))
gdb.events.stop.connect(stop)
(gdb) source stop.py
SIGABRT, abort.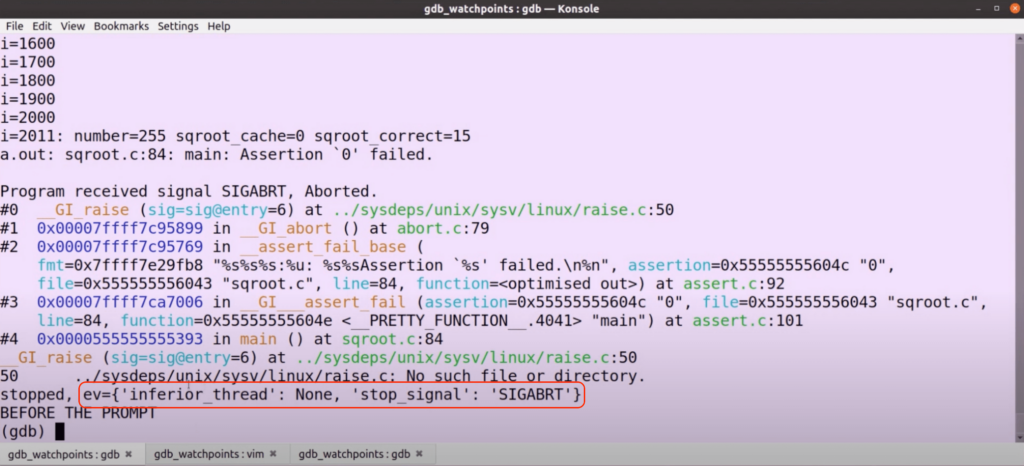
exited event, just when the program exits. You can have a cont event, which you can hook before the program starts. You can have memory_change or register_change events or even breakpoint events such as breakpoint_created, breakpoint_modified or breakpoint_deleted.Where to go for more information?
$ info gdb

Don’t miss my next GDB tutorial: sign up to the gdbWatchPoint mailing list now.
Want debugging tips directly in your inbox?
Share this tutorial