WatchPoint

How to Work with Signals in GDB?
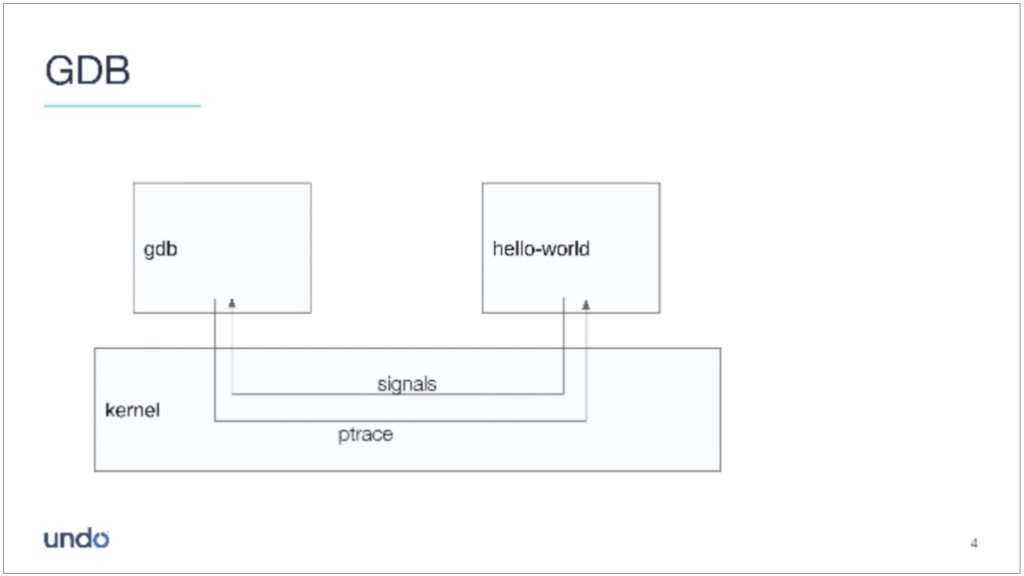
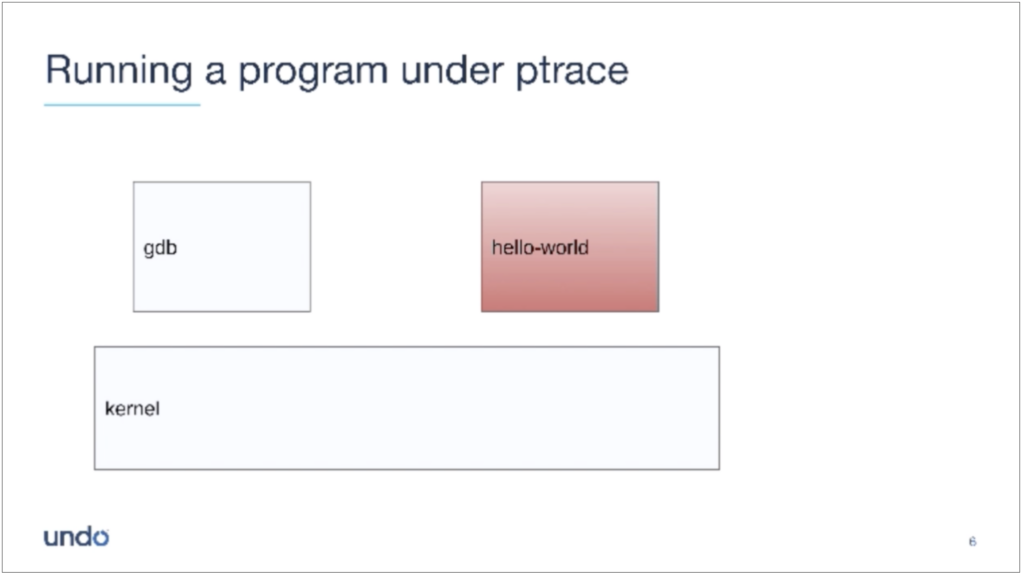
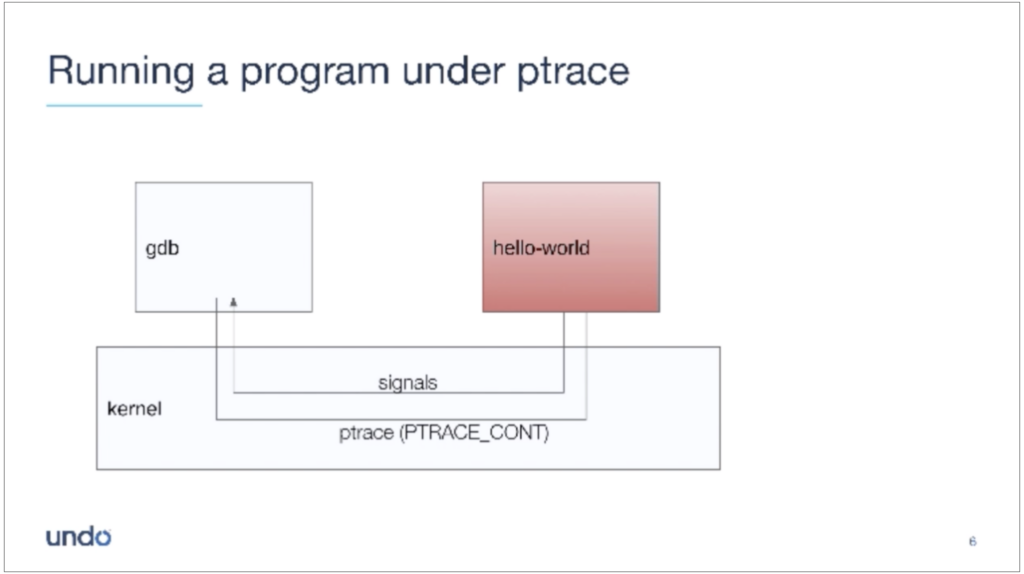
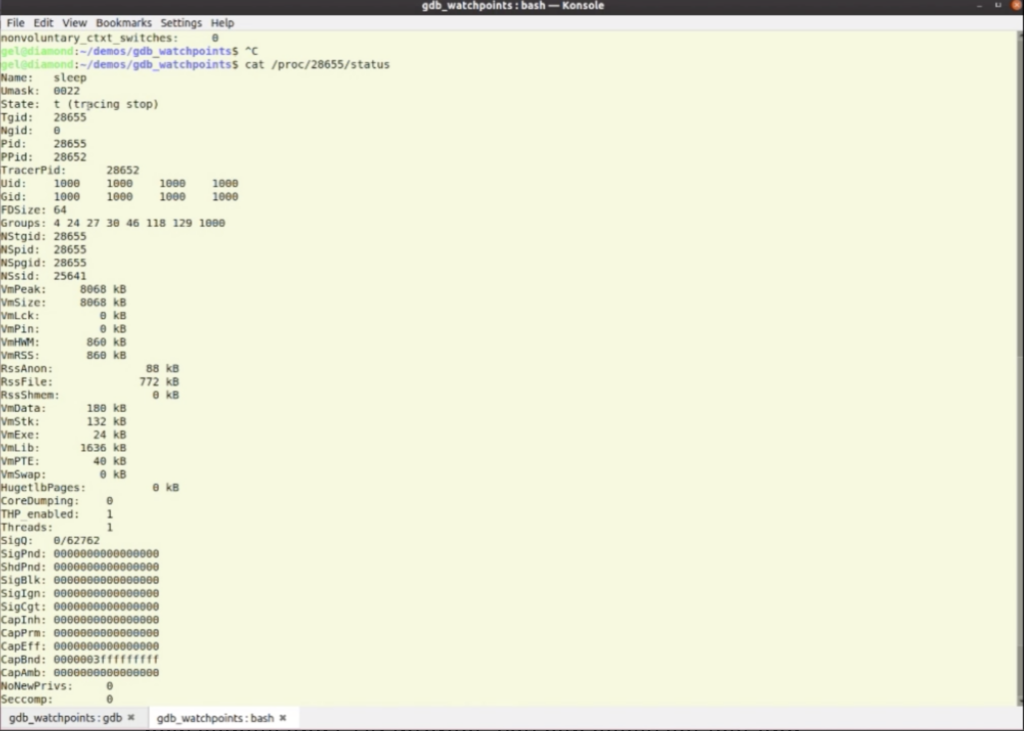
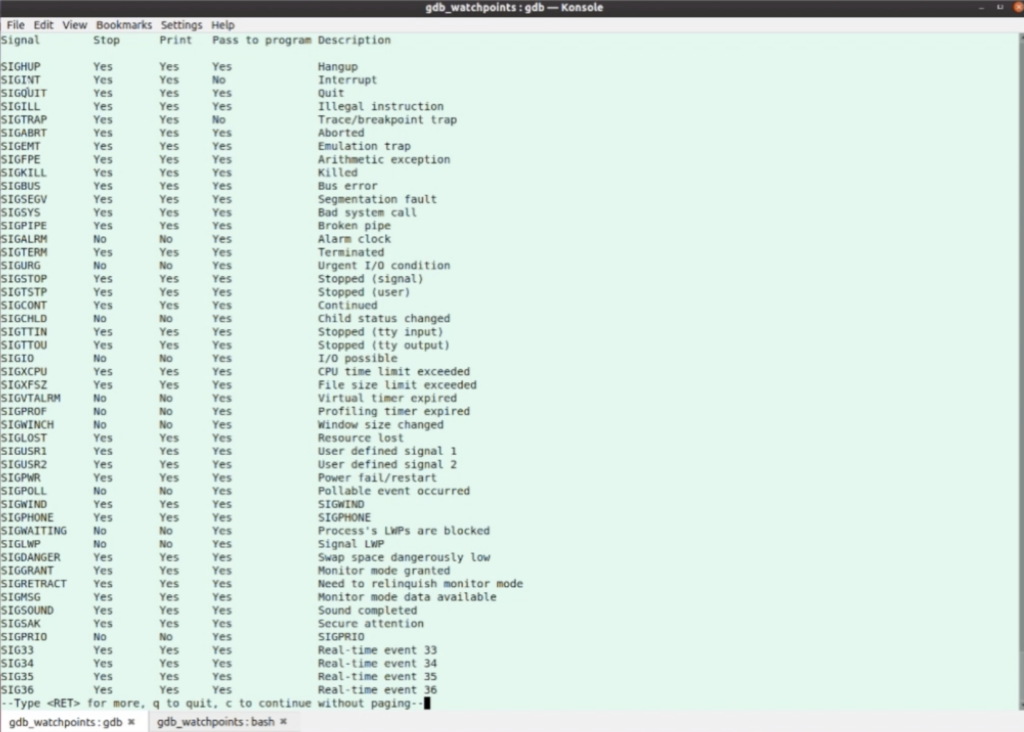
Some of the trickiest bugs to track down involve signals and signal handlers. Inherently asynchronous, and some subtle rules about how to use them combined can cause programmers many sleepless nights. GDB can be a handy tool to help track down these issues, but if you do not understand how signals and GDB interact, you can easily get lost and even end up more confused than when you started! To get the most out of GDB and signals, we need to understand a little bit of the theory first. GDB controls the program that we are debugging (the inferior) through a system call named ptrace(). It is not the most elegant system call, but it works. It lets GDB observe and control the execution of the inferior program. ptrace() can, for example, set the registers, peek and poke memory, continue or interrupt the inferior — all the good stuff we need for debugging. The inferior and GDB asynchronously communicate via signals. Let’s explore what this means. In my diagram below, the inferior program (the red box) stopped. It is in a “tracing stop” state. I will show you later how we can check the status inside the proc filesystem. To start the inferior program, we type continue, which triggers a PTRACE_CONT command. GDB now waits while the inferior program is running until something happens, or more specifically, until the inferior receives a signal. Technically, GDB calls waitpid(), waiting for the inferior, and the only thing that will wake up GDB is the inferior (or GDB itself) when it receives a signal. For example, the code may hit a breakpoint, which generates a SIGTRAP. GDB effectively intercepts the SIGTRAP, leaves the inferior in a “tracing-stop” state, and returns to the prompt. Or, we hit Ctrl-C on the terminal. The kernel responds to this by delivering SIGINT to the inferior, which GDB intercepts and drops down to the prompt. Or, perhaps the inferior tries to access memory via an invalid address. It will now get a SIGSEGV or SIGBUS signal, and again GDB will intercept it. In any case, GDB wakes up and detects the signal that the inferior received. The inferior goes into a “tracing-stop” state. Note that, at this point, the inferior did not receive the signal. It is up to GDB to pass the signal to the inferior program or not. It will do different things for different signals by default. For example, for a SIGINT signal, when we hit Ctrl-C and type continue, it will start the inferior program where it left off, without delivering the signal. GDB will not deliver the SIGINT to the inferior. The program won’t terminate, which in most debug cases is the behavior we require, or if there is a signal handler for SIGINT, the handler won’t run. We want to continue to run or step through the program some more. Let’s look at how this theory works in practice. We need a program that we can interrupt, so let’s run the sleep command in GDB. The sleep program is now running, but when we hit Ctrl-C, the program will receive a SIGINT, and we return to the GDB-prompt; GDB has control. Let’s check the state of the sleep program. First, we need the process ID. We can see that the process ID is 28655. We can now lookup the status of the program in the proc filesystem by typing $ cat /proc/28655/status. You can see that the program is in a ‘tracing stop’ state, which, as I described earlier, is the expected behavior. If we now type continue in the GDB-prompt, then the program continues, aka returns to sleep. We can tell GDB in advance what to do for each signal it receives. We use the handle command for this. This command prints a table of most signals and how GDB handles each one. You notice that for the SIGINT signal, the default settings in the handle are: Because the GDB does not allow the inferior program to see the SIGINT (nopass), we can continue the program after hitting Ctrl-C. SIGINT and SIGTRAP are the only signals that do not pass to the inferior program by default. But, perhaps our inferior program has a SIGINT handler, and therefore we must pass the SIGINT to the program. In that case, we can change the default setting with the handle command. If you hit Ctrl-C now, the program will terminate because GDB sends the SIGINT to the program as we specified. I do demonstrate this in my video, so I would like to encourage you to watch it here. Important: Do not forget to put the handle back to the default SIGINT setting, so next time we get the expected GDB behavior. Surprise! Not all signals follow the behavior that I described in this tutorial. If your inferior is in one of the following system calls when it receives a signal, then GDB will not see that signal: If we are using these system calls in our program, and our program stops in one of the calls, and it receives a signal for which it is waiting, then the signal will never make it to the program. The kernel consumes the signal, the program only hears about it as the return result of the system call, and GDB will not get any notification that it happened. Nothing we can do about it. I do demonstrate these system calls scenarios in my video, so I encourage you to watch it here. That is it for this tutorial. I hope it helps you work your way around signals with GDB and save time debugging your code. And, remember that for sigwaitinfor() and sigtimewait(), if your program receives a signal that one of these system calls is waiting for, GDB won’t see it! No more debugging nightmares! GDB TrainingWatch the video
The role of ptrace() in GDB

What happens when GDB detects a signal?
How does GDB handle Ctrl-C?
gdb --args sleep 10000
(gdb) r
Starting program: /usr/bin/sleep 10000
(gdb) info proc
process 28655
cmdline = ‘/usr/bin/sleep 10000’
cwd = ‘/home/gel/demos/gdb_watchpoints’
exe = ‘/usr/bin/sleep’
Why does Ctrl-C not terminate the program?
(gdb) info handle
(gdb) handle SIGINT print stop pass
SIGINT is used by the debugger.
Are you sure you want to change it? (y or n) y
Signal Stop Print Pass to program Description
SIGINT Yes Yes Yes Interrupt
(gdb) c
Continuing.
(gdb) handle SIGINT print stop nopass
WARNING: GDB does not see all the signals!
Master GDB and save time debugging complex codebases
Learn more »
Want debugging tips directly in your inbox?
Share this tutorial