Resources
How To Fix a C/C++ Runtime Error With Time Travel Debugging
Introduction
Time travel debugging enables developers to rapidly resolve runtime errors without needing to invest time and effort into replicating issues. It shortens the traditional debugging workflow, and enables us to get to the root cause of bugs with 100% certainty. This, in turn, allows us to fix bugs in our programs more quickly and easily. The question is, how?
This walkthrough guide outlines how time travel debugging works with a C/C++ application running on Linux. For this, we will be using UDB, Undo’s time travel debugger.
Walkthrough
Our starting point is a simple example application called Cache Calculate.
When we run this application, we can see that it runs to a point, but then crashes.
Let’s use UDB to analyze the execution of this program and diagnose what caused this failure.
First, we will type backtrace to look at the call stack, and see a summary of how our program has just got to where it is.

Because UDB is a time travel debugger, we can run the execution of the program in reverse.
So, we will use the reverse-finish command twice, to reverse up the stack to the abort() statement in main() at cache.c line 85.

Note: in UDB, like GDB, pressing Enter on an empty line repeats the previous command.
Now, we’ll switch into TUI (Text User Interface) mode, so that we can more easily see what’s going on in the source code.
To do this we press Ctrl+X followed by A.

Unlike forward debugging, the great thing about a time travel debugger is that we can go back to any line of code that executed and see the complete program state.
We’ll now type info locals to inspect the state of the variables at this point.
This shows us that the integer square root of 255 is 15 (in sqroot_correct). But sqroot_cache is 0, which is the wrong value.

This is the point at which the bug presents, but it’s not the root cause.
Next, we need to track down the point where the cache is populated with the incorrect value.Line 78 is where the sqroot_correct variable is set.
The reverse-next command can be used to execute the program backward to the previous source line in the same file.
So we use the reverse-next command 3 times, to jump back in time to line 78.

We can see that the previous line is where the sqroot_cache variable is set to its incorrect value.
The reverse-step command executes the program backward until it reaches a different source line.
So we’ll use the reverse-step command once to step back into the cache_calculate() function, and again to go back to line 39, where it returns this incorrect value.

Now we need to inspect what the value is equal to at this point.
To do this, we’ll type print g_cache[i].
Which gives us this:

We see that the square root stored in the cache for 255 is 0; which is incorrect.
Next, we need to find out where this cache entry was populated with the incorrect value. We can do this by setting a watchpoint (also known as a data breakpoint) on the incorrect entry in the cache, and running back in time to where it was set.
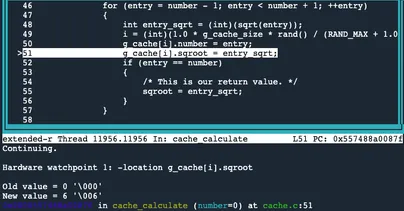
First, to set the watchpoint we’ll type, watch -l g_cache[i].sqroot.

Next, by typing reverse-continue we can run backward in time to see where this value was written to.

The incorrect value was written to g_cache[i].sqroot.
We’ll type info locals again, to see the state of the variables at this point.

Here we see that sqroot_adj is a very large negative number. But when stored into g_cache[i].sqroot, it is being stored as value 0. This suggests a type casting error. We need to investigate why the large negative number is being stored as a 0.
So, let’s print the type of the variables by typing the following:
ptype sqroot_adj
ptype g_cache

The data structure shows the array which is made up of 100 pairs of unsigned char. But unsigned char can only hold values 0 to 255, so when sqroot_adj is stored in the cache, its value is shortened.
So, now we know how we got the zero, and similarly, when -1 is cast to an unsigned char, it becomes 255, but where did the -2,147,483,648 actually come from?
Line 48 shows that sqroot_adj is set to sqrt(number_adj), and statically cast to an integer as sqrt() returns a double.
If we type print sqrt(number_adj) it returns the following:

And now, we have discovered that the root cause of this application failure happens as a result of attempting to put the square root of -1 into the cache, which was not intended.
The reason for this is that for loop in line 46 loops from number-1 to number+1, but there is no protection anywhere in the code to deal with the special case that we just hit, where the number is zero.
This error could have been avoided by adding the following statement at the start of the for loop: if (number_adj < 0) continue;
Conclusion
So that’s how time travel debugging enables developers to run backward through the execution flow of a program and drill down into what happened, in order to quickly identify the root cause of the program crash.
As shown, it is an easy and efficient debugging process, the principles of which can, of course, be used to debug much more complex code. You can try some of the features of time travel debugging out for yourself on your own application, by downloading a free UDB trial (desktop software only).
And if you prefer not to use a CLI debugger and would rather debug within VS Code or CLion, UDB also works with both of these IDEs.