Resources
Using a reverse debugger to recover from stack-corruption
If a program overwrites its own program counter register, it is almost impossible to recover using a conventional debugger – without the program counter, the debugger cannot figure out which function the program was running, and so cannot even give any useful information about what is on the stack or where the code was immediately before the stack was corrupted. This makes debugging pretty much impossible.
With a reverse debugger however, recovery is almost comically simple. You can simply do:
reverse-step– to rewind one instruction, and the state of the program will move back to the instruction that corrupted the program counter, allowing you to see what’s gone wrong. This will also allow the debugger to know what function was running and so be able to interpret the stack and display it to you in a useful way. You can replay your code and subsequently find the issue in order to then debug and fix it quickly.
For example, in this program, the function foo overwrites its stack with zeros and then attempts to return, which results in the program counter registers being set to zero.
#include <strings.h>

static void
foo( void)
{
    int b[1];
    bzero( b, 100); /* Overwrite our own stack. */
    return;
}

int
main( void)
{
    foo();
    return 0;
}
The program crashes when run:
> gcc -g foo.c
> ./a.out
Segmentation fault (core dumped)
Looking at the core file with gdb doesn’t give us much information because the program counter register has been trashed, so there’s no usable backtrace:
> gdb -q a.out core
Reading symbols from .../a.out...done.
[New LWP 30704]

Core was generated by `./a.out'.
Program terminated with signal 11, Segmentation fault.
#0 0x0000000000000000 in ?? ()
(gdb) backtrace
#0 0x0000000000000000 in ?? ()
#1 0x0000000000000000 in ?? ()
(gdb) info reg pc
pc 0x0 0x0
(gdb)
Running under gdb doesn’t help either – there’s still no backtrace after the program crashes:
> gdb -q a.out
Reading symbols from .../a.out...done.
(gdb) run
Starting program: .../a.out

Program received signal SIGSEGV, Segmentation fault.
0x0000000000000000 in ?? ()
(gdb) backtrace
#0 0x0000000000000000 in ?? ()
#1 0x0000000000000000 in ?? ()
(gdb) info reg pc
pc 0x0 0x0
(gdb)
However, with UDB (formerly known as UndoDB), we can quickly figure out what has gone wrong:
> udb a.out
UndoDB reversible debugger 6.1.4 (build 25). Copyright 2020 Undo Ltd.
Reading symbols from a.out...
Using GNU GDB 9.2:
Copyright (C) 2020 Free Software Foundation, Inc.
License GPLv3+: GNU GPL version 3 or later <http://gnu.org/licenses/gpl.html>
This is free software: you are free to change and redistribute it.
There is NO WARRANTY, to the extent permitted by law.
Type "show copying" and "show warranty" for details.
For help, type "help".
For quick-start help on UndoDB, type "help udb".
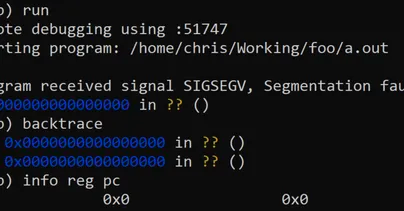
(udb) run
Remote debugging using :51747
Starting program: /home/chris/Working/foo/a.out
Program received signal SIGSEGV, Segmentation fault.
0x0000000000000000 in ?? ()
(udb) backtrace
#0 0x0000000000000000 in ?? ()
#1 0x0000000000000000 in ?? ()
(udb) info reg pc
pc 0x0 0x0Do the reverse-stepi trick to recover from the program counter corruption:
(udb) reverse-stepi
0x0000555555555171      9       }
(udb) backtrace
#0  0x0000555555555171 in foo () at foo.c:9
#1  0x0000000000000000 in ?? ()
Now we know where we are, we can step back and figure out what went wrong:
(udb) reverse-next
8           return;
(udb) backtrace
#0  foo () at foo.c:8
#1  0x0000000000000000 in ?? ()
(udb) reverse-next
7           bzero( b, 100); /* Overwrite our own stack. */
(udb) backtrace
#0  foo () at foo.c:7
#1  0x000055555555517f in main () at foo.c:14
(udb)
So UDB has enabled us to figure out exactly what has gone wrong in seconds.