AI-powered root cause analysis for large-scale complex applications
Undo gives your coding agent the runtime context it needs to solve the hardest problems in complex software.
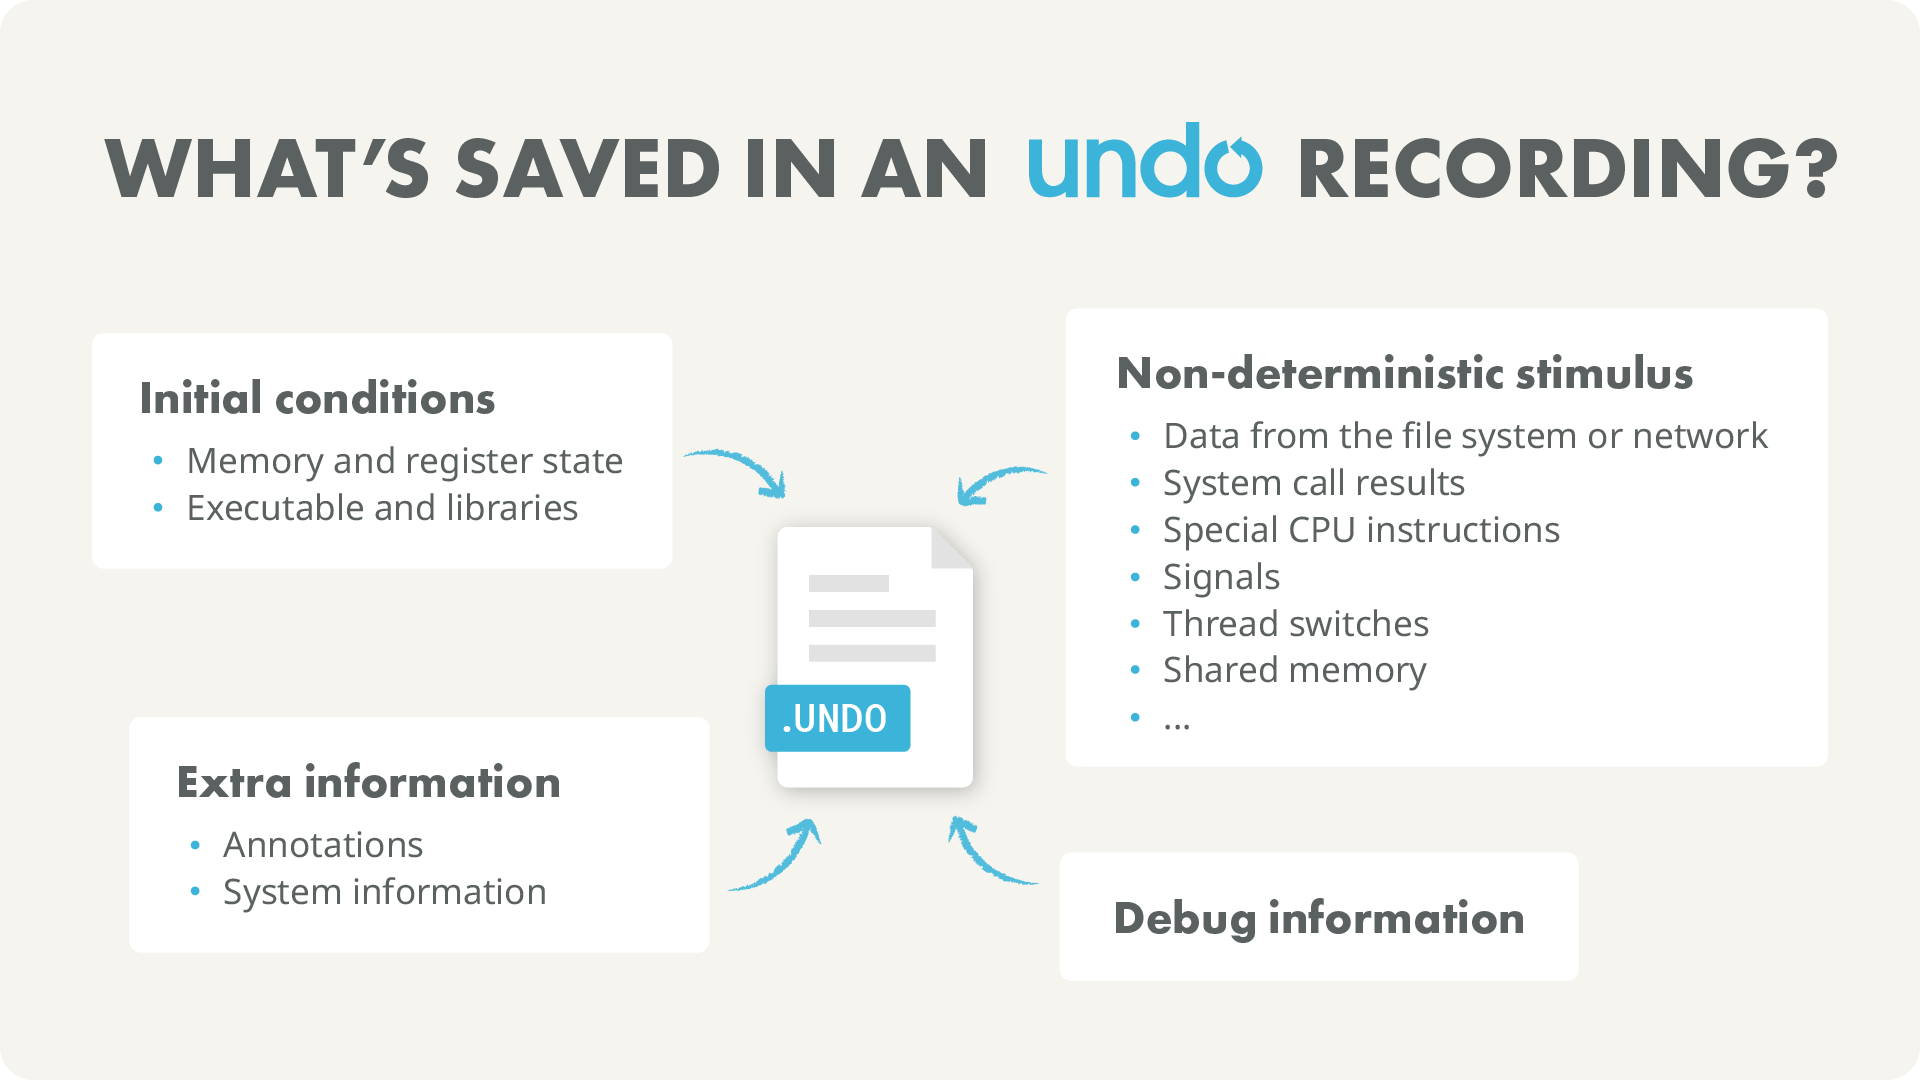
Undo captures complete program execution – every state change, execution path, function call and data flow – into a recording file and makes that recording available to coding agents.
Recordings are the antidote to hallucination. They are the only way agents can access the runtime context needed to understand what actually happened, reason about software behavior, and solve problems that code alone cannot explain.
- Automate root cause analysis of non-trivial issues (e.g. concurrency defects, memory corruptions, flaky tests) and get tickets resolved
- Resolve issues up to 100x faster – deliver software faster or resolve customer issues faster
- Solve problems previously beyond the reach of AI agents and maintain a stable codebase at scale
AI-Powered Root Cause Analysis
with Full Execution Context
Modern AI coding assistants like Claude Code, Copilot, Codex, and Cursor can read static code and suggest fixes — but they can’t see what actually happened at runtime.
Undo gives AI that missing context, so you can avoid AI hallucinations.
Undo’s deterministic recording technology records a program’s exact execution: every variable, every event, every I/O, across every module.
Agents can then query the recording to reason about dynamic behavior the way they already reason about code.
With access to a deterministic execution recording — AI agents can:
“ Trace exactly when and why a variable changed“
“ Identify the root cause of crashes or exceptions“
“ Follow the precise chain of events that led to a failure“
Using Undo AI, engineers — and their coding agents — can ask questions like:
“ Why did this variable change here?“
“ What caused this null pointer dereference?“
“ What was the thread state when the crash occured?“


APPLICATIONS
FIX BUGS IN THE FIELD (OEM SOLUTION)
The hardest bugs are ones that only happen on the customer’s system.
Ship Undo as part of your product. Switch it on to capture the bug in a recording file and switch it off. The recording will contains all the execution data you need. Root cause the issues without repeatedly sending builds to the customer and searching for a minimal reproducer.
Undo is used in production by some of the world’s most confidentiality-sensitive businesses. Send the recording back to your engineers for analysis, debug it in the field or exchange auditable, text-based analysis scripts for maximum transparency.
WHAT SOFTWARE ENGINEERS SAY
An intermittent stack overflow crash was left unresolved for over 6 months. We solved the issue in a week with LiveRecorder.
Software Engineer
We fixed a memory corruption issue in 10 minutes which would have initially taken up to 5 days.Read More
Routing Engineer
LiveRecorder enabled me to resolve an issue in half a day that I might have never been able to resolve.
Sanjay Khanna
KEY FEATURES
PORTABLE RECORDING FILES
ADVANCED STATE INSPECTION WITH TIME TRAVEL
CATCH RACE CONDITIONS
GDB COMPATIBLE
IDE INTEGRATION
WORKS WITH YOUR EXISTING SYSTEMS
API CONTROL
FASTER THAN YOU THINK
1ST CLASS SUPPORT
CI & TEST AUTOMATION TOOLS
Want to automate the generation of recording and store them in your CI or bug tracker?
No problem. You can integrate Undo with all popular CI and Test Automation tools, including Jenkins, Maven, Circle CI, or TeamCity.
The core technology is language independent and compatible with most mainstream Linux distributions.


COMMON QUESTIONS
Here are some frequently asked questions and answers you may find helpful. Detailed technical documentation is also available in the docs.
We use binary instrumentation to capture only the bare minimum data required to record execution as efficiently as possible. To keep the overhead low, we don’t translate instructions that don’t require it.
The recording contains all information required to recreate the entire memory state of the recorded process at any machine instruction that was recorded. This includes memory maps, any data read from the file system, network or the kernel generally, and the executable and libraries that were involved with running the application.
Undo works with normal releases without any code or build changes, so you don’t need to modify your code and you need to recompile.
Undo is capable of handling multithreaded applications. Some of our customers record applications with 30-40 active threads and 100s of less active threads. For example it is used on SAP HANA – a heavily multithreaded application that uses custom memory allocators, custom threading libraries and that typically runs on a machine with 100s of cores and terabytes of RAM. Read case study
We don’t usually recommend running all your regressions under recording because the overheads can be significant. Instead, do 2 things:
- Configure the test system to re-run failing tests under recording (often up to some upper limit of iterations or for some fixed length of time to catch flakiness)
- Create a subset of regression tests that are known to be flaky, and run them repeatedly with recording enabled.
The first is useful for a “pre merge” flow; the latter for if you have a “flaky test problem” (which most engineering teams do to some degree).