The time travel debugger for large-scale enterprise applications
With time travel debugging, developers working on millions of lines of Linux code can now diagnose the root cause of their hardest bugs in hours (not weeks).
Turn weeks of engineering effort into an afternoon debugging session, by getting a full picture of what the program did across subsystems and threads to quickly get an answer to your questions.
- Deliver well-crafted software
- Complete code deliverables on time
- Reduce the pressure that come with debugging customer issues
Ideal for non-trivial bugs e.g. concurrency bugs caused by multithreading, memory corruptions, or flaky tests
What is
Time Travel Debugging?
Record a process. Replay the recording.
Reconstruct and examine the full state of the program at any point in time. Step back in the execution history to inspect the code flow to see what happened.
Record
Record the bug (on demand or in automated test), capturing the full program execution in a single binary file.
No code or build changes are required thanks to Undo’s just-in-time binary instrumentation.
Replay
Any question you have can be answered from a recording. No more “how did that happen?”.
Recordings are portable, so they can be replayed outside of the original environment and shared with your team.
Resolve
Examine the full state of the program at any point. Go back and forward in time with ease.
Trace from symptom to root cause in one cycle – without having to restart your debug session or recompile.
HOW DOES IT WORK?
UNDO COMES WITH 2 COMPONENTS
LiveRecorder
For generating recordings of your software execution
UDB
For replaying these recordings or for debugging live processes
WATCH BELOW HOW IT WORKS
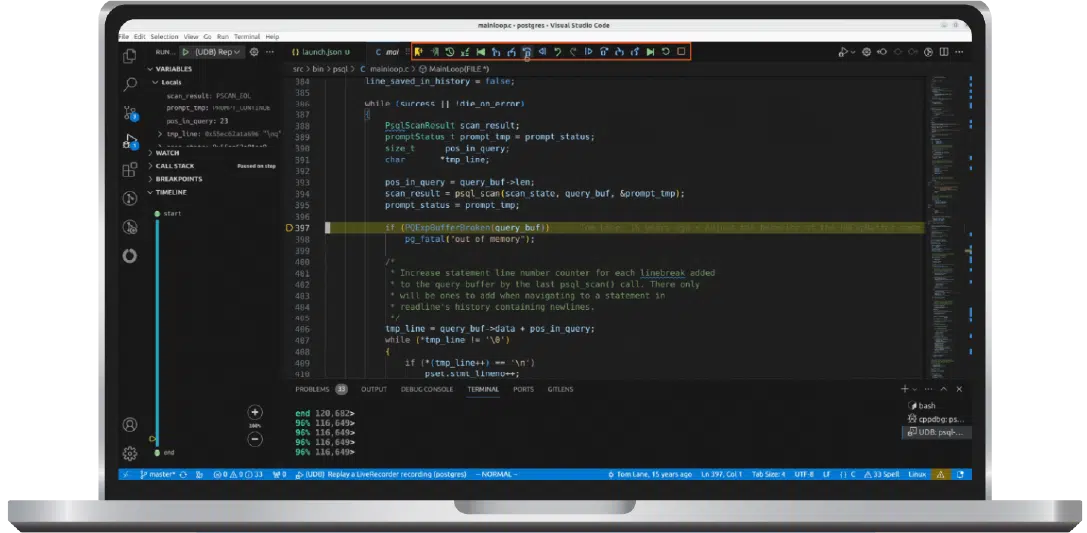
100% compatible with GDB, so no need to learn a new tool – just a handful of new commands.
Also available as a VS Code extension or CLion plugin.
WHAT SOFTWARE ENGINEERS SAY

An intermittent stack overflow crash was left unresolved for over 6 months. We solved the issue in a week with LiveRecorder.
global networking vendor
We fixed a memory corruption issue in 10 minutes which would have initially taken up to 5 days.
Routing Engineer
LiveRecorder enabled me to resolve an issue in half a day that I might have never been able to resolve.
Distinguished Engineer, Juniper Networks
KEY FEATURES
PORTABLE RECORDING FILES
TIME TRAVEL
CATCH RACE CONDITIONS
GDB COMPATIBLE
IDE INTEGRATION
WORKS WITH YOUR EXISTING SYSTEMS
API CONTROL
FASTER THAN YOU THINK
1ST CLASS SUPPORT
Shows the whole state of the application - look anything
See how state changed over time - see the story of how things go wrong
Bug capture (including intermittent bugs) is automated
Explore how the code is executed dynamically - every line of code in every thread, every variable, every I/O
Go back to something that happened last week/month
Allows collaboration on the same issue
See what the software really did (not what it was expected to do)
Want to automate the generation of recording and store them in your CI or bug tracker?
No problem. You can integrate Undo with all popular CI and Test Automation tools, including Jenkins, Maven, Circle CI, or TeamCity.
The core technology is language independent and compatible with most mainstream Linux distributions.


Step Into A
Time Machine
- See what your software really did
- Solve hard bugs – fast
- Understand unfamiliar codebases
No extra set up steps required.
Get started in 2 minutes.
COMMON QUESTIONS
Here are some frequently asked questions and answers you may find helpful. Detailed technical documentation is also available in the
Didn’t find the answer to your question? Ask below and we’ll get back to you shortly.
We use binary instrumentation to capture only the bare minimum data required to record execution as efficiently as possible. To keep the overhead low, we don’t translate instructions that don’t require it.
The recording contains all information required to recreate the entire memory state of the recorded process at any machine instruction that was recorded. This includes memory maps, any data read from the file system, network or the kernel generally, and the executable and libraries that were involved with running the application.
Undo works with normal releases without any code or build changes, so you don’t need to modify your code and you need to recompile.
Undo is capable of handling multithreaded applications. Some of our customers record applications with 30-40 active threads and 100s of less active threads. For example it is used on SAP HANA – a heavily multithreaded application that uses custom memory allocators, custom threading libraries and that typically runs on a machine with 100s of cores and terabytes of RAM. Read case study
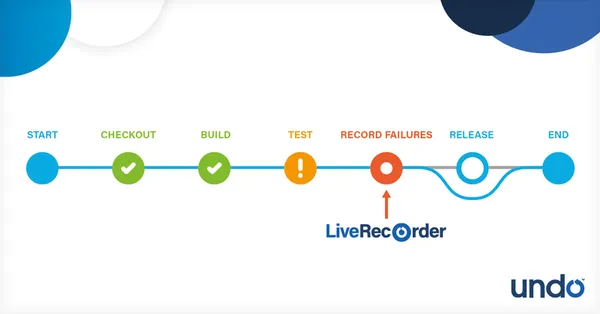
We don’t usually recommend running all your regressions under recording because the overheads can be significant. Instead, do 2 things:
- Configure the test system to re-run failing tests under recording (often up to some upper limit of iterations or for some fixed length of time to catch flakiness)
- Create a subset of regression tests that are known to be flaky, and run them repeatedly with recording enabled.
The first is useful for a “pre merge” flow; the latter for if you have a “flaky test problem” (which most engineering teams do to some degree).