Resources
Time Travel Debug in VS Code

We’re happy to announce that time travel debugging is now available in Visual Studio Code (VS Code) via the Time Travel Debug for C/C++ plugin.
Time Travel Debug for C/C++ places time travel debugging capabilities at the fingertips of developers using VS Code. The technology is based on the UDB time travel debugger.
With this plugin, developers can now travel forward and backward through full code execution in order to:
- Get full visibility into the state of the code they’re working on – at any point in its execution
- Understand complex code and how it all hangs together
- Accelerate root cause analysis and reduce bug-fix time
By debugging this way, programmers can conduct effective root-cause analysis (without needing to predict ahead of time what to log), and avoid disruptive redeployments.
How does it work?
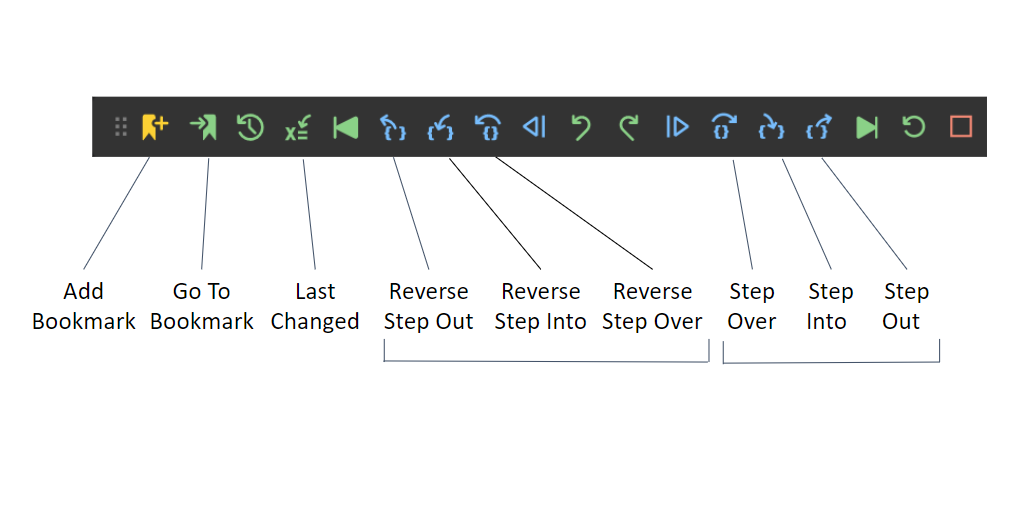
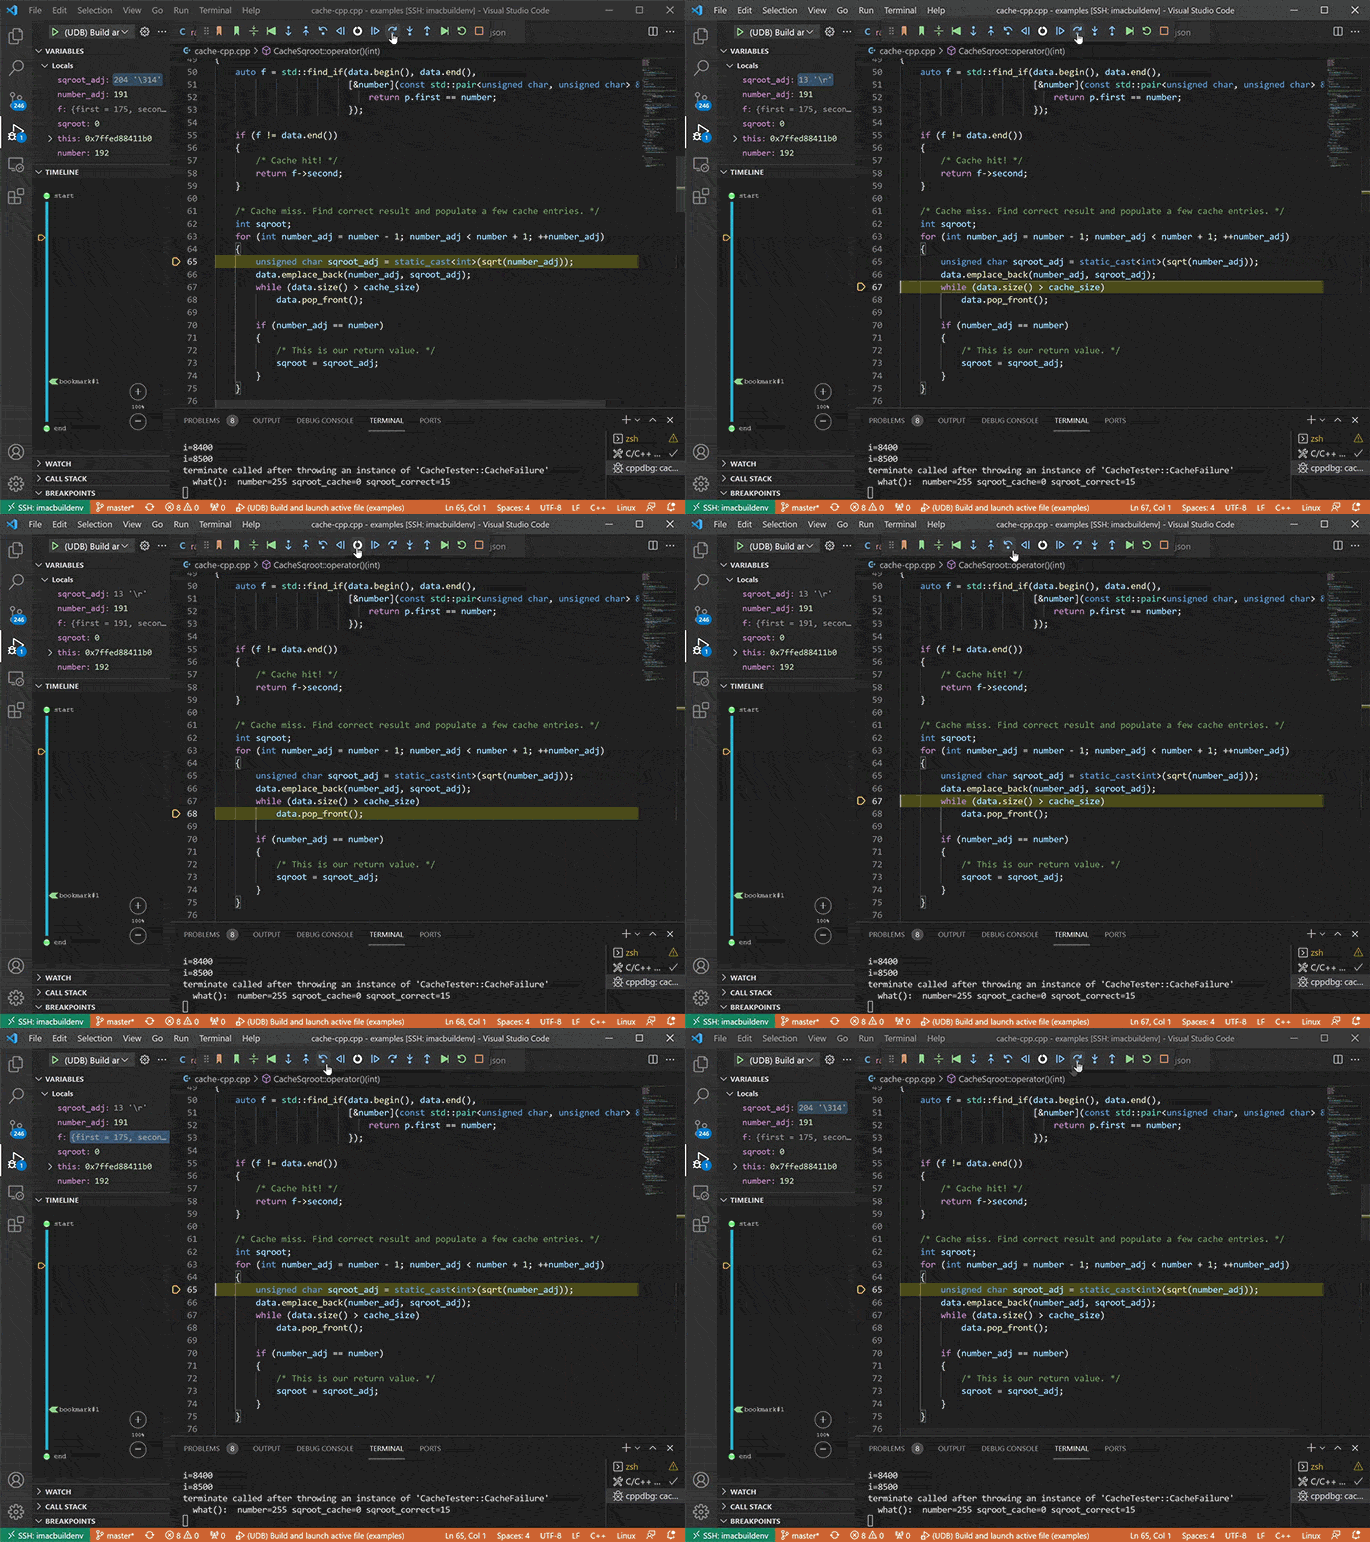
The plugin adds a time travel debugging toolbar to your VS Code interface so that you can step through the code forward and backward and watch variable and memory changes as your navigate forward and in reverse to understand what the software did.


How to get started with Time Travel Debug for C/C++
Key features
Here’s a summary of the key feature capabilities added to VS Code:
- Navigate backward and forward through code execution: Reverse Step In/Out/Over joins the familiar Step In/Out/Over
- Launch, Attach, or Replay a LiveRecorder recording
- Continue and Reverse Continue, stopping at Breakpoints / Conditional Breakpoints / Watchpoints
- Inspect global and local variable values at any point in your program’s execution history
- Timeline – visually navigate and zoom through the execution flow
- Bookmarks – set bookmarks at any point in your program’s execution history. These appear on the timeline and can be easily jumped to
- Undo your last navigation action
- Evaluate expressions and call functions in the Debug Console at any point in your program’s execution history
Making VS Code better for developers
Microsoft’s IDE provides a rich development environment, including debugging capabilities such as variable inspection, stepping into code, and displaying the call stack. The great thing about VS Code is that it is highly extensible. With this integration we’ve taken advantage of that extensibility, and by adding time travel debugging superpowers, we’ve made it substantially quicker and easier to understand complex C/C++ codebases and the conditions that led to a specific error.
Try it out for yourself
Give it a try and don’t forget to leave your review on the VS Code marketplace.

