Resources
Reverse debugging concurrency issues using multi-process correlation
The problem – concurrency
Companies requiring high performance have increasingly turned to various concurrent computing techniques in which several threads of execution operate simultaneously. This trend is largely a reaction to the fact that single core CPU speeds have plateaued since the 2000s.
Multithreading
One approach to achieving concurrency is multithreading. Multithreading allows the application to exploit several CPU cores simultaneously on a single machine. This comes at the expense of introducing several new potential failure modes (e.g. non-deterministic behavior, read after write hazard, race conditions, etc.) which can make the application very complex and difficult to debug. LiveRecorder helps developers to reproduce, debug and diagnose these difficult types of defects.
Multiprocess
To avoid the complexities of multithreading, some developers turned instead to making use of multiple processes on a single machine. Similarly to multithreading, this technique allows the application to exploit several CPU cores simultaneously on a single machine. Additionally, it reduces the complexity and internal interdependencies within the application by relying on the operating system to enforce isolation between the processes’ unshared memory.
Each individual process in a multiprocess application is simpler and easier to debug in isolation than a monolithic multithreaded application. However, for processes that communicate with each other by manipulating data structures in a shared memory region, concurrency issues such as non-deterministic behavior, read after write hazards and race conditions still remain. Worse, this space is not well served by existing tooling. At Undo, we wondered whether we could bridge the gap.
The challenge of recording and replaying multiprocess
LiveRecorder already supports recording and replaying processes which access shared memory – irrespective of whether the other processes that write to the shared memory region are themselves being recorded.
It does this by treating reads from shared memory like other non-deterministic inputs (such as file or network I/O) and storing the data in the recording file for injection at replay time. LiveRecorder uses the system’s memory management unit (MMU) and JIT binary retranslation of the program to make this performant.
The advantage of this approach is that the recording file that LiveRecorder creates is always self-contained. The recording can be replayed and debugged in isolation – even if the recorded process was part of a multiprocess application.
When recording multiple processes in a multiprocess application, this approach has the fundamental limitation that LiveRecorder does not capture any information about the relative ordering of accesses to the shared memory region. This can make it difficult to reason about hazards and race conditions.
Multiprocess Correlation for Shared Memory
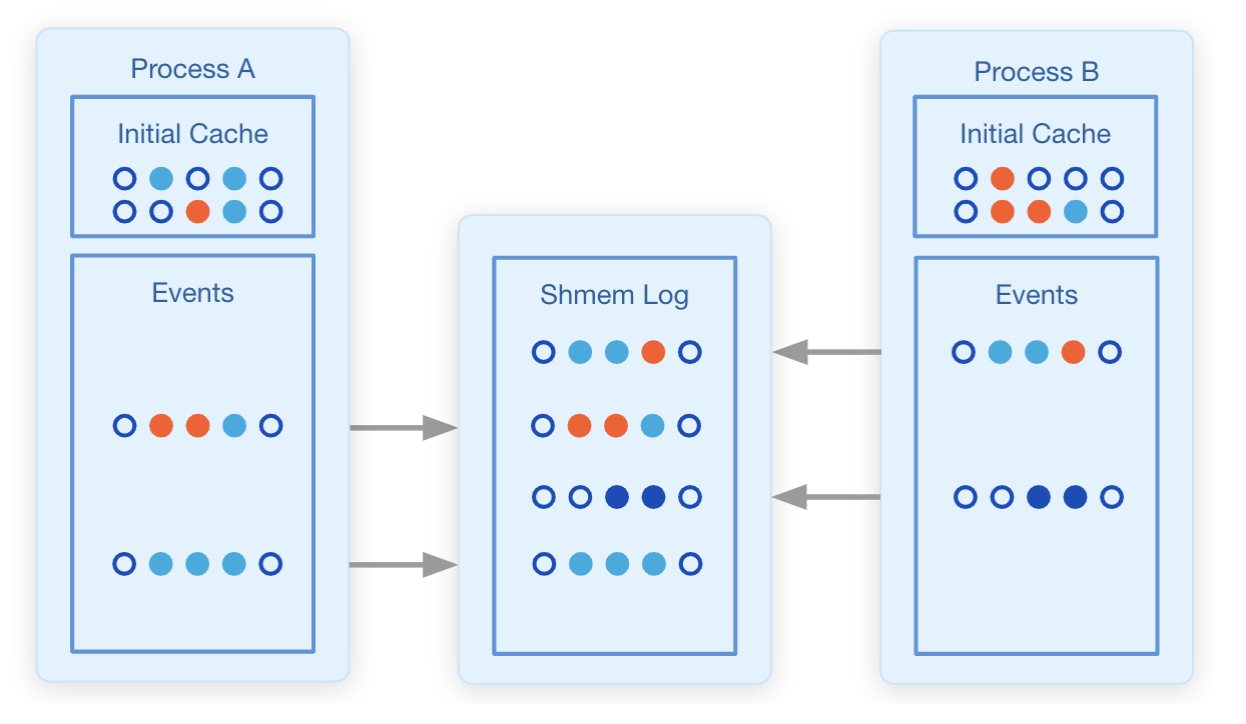
We wanted to address this limitation with LiveRecorder 5.0. The approach that we took was to build on the existing specialized support in LiveRecorder 4.x for handling shared memory regions, and enhance it to store read and write events to the shared memory region in a new recording file which we call the “Shmem log”.
To achieve this, we create the Shmem Log as a memory-mapped file that is mapped into the address space of every process in the application. Each time a process touches the shared memory region, it also writes an event to the Shmem Log indicating that it has done so. Since the Shmem Log is a memory-mapped file, the operating system takes care of writing it out as a recording file.
In order to make this approach performant, we re-use the optimizations and JIT binary retranslation of the program from LiveRecorder 4.x. We also make some assumptions – that all the processes within the application must be running under recording by LiveRecorder and that the application creates its multiple processes by forking after the shared memory region is created.
This new approach means that we capture the ordering of the various processes’ accesses to the shared memory region, while retaining the ability to record and replay each process’ recording in isolation.
Now that we had an ordering of accesses to shared memory, we needed to provide a way to expose this information to a developer. We added a new ublame command to UDB (LiveRecorder’s replay engine – used to replay the recordings generated by LiveRecorder). The output looks like this:
In this example, the ublame command tells the developer that two processes, with process IDs (PIDs) 18813 and 18809, have interacted with the data structure of interest in shared memory.
We added an additional ugo inferior command to allow the developer to jump to a process and point in time of interest – in this example the point in time that a process last wrote to the data structure:
(udb) ugo inferior 187e23cf-aa8d 18,379:0x402666
Summary
With the ublame and ugo inferior commands developers can use LiveRecorder 5.0 to diagnose multiprocess concurrency issues around data structures held in shared memory.
Future Work
For future LiveRecorder releases, we are currently working on the following enhancements to the Shmem Log approach:
Consolidated recording file – The multiple recordings of separate processes each contain partial copies of the shared memory region, potentially containing duplicate information. We are investigating the pros and cons of generating a single consolidated and de-duplicated recording of the entire application. This would reduce recording file size, especially for long-running applications.
Multiple inferiors – The ugo inferior command in LiveRecorder 5.0 allows the developer to jump to another process recording at a point in time of interest, but it does this by discarding the current process recording.
IDE support – We’re investigating alternative ways to display the ordering information that is stored in the Shmem Log to the developer, including within the various IDEs that Undo support.
Request a demo
Want to see a demo of how you can record and replay multiple processeses with LiveRecorder to diagnose bugs faster?


