Built for Linux C/C++ Developers
Root cause your hardest bugs in hours, not weeks
Low-overhead time travel debugging for millions of lines of code
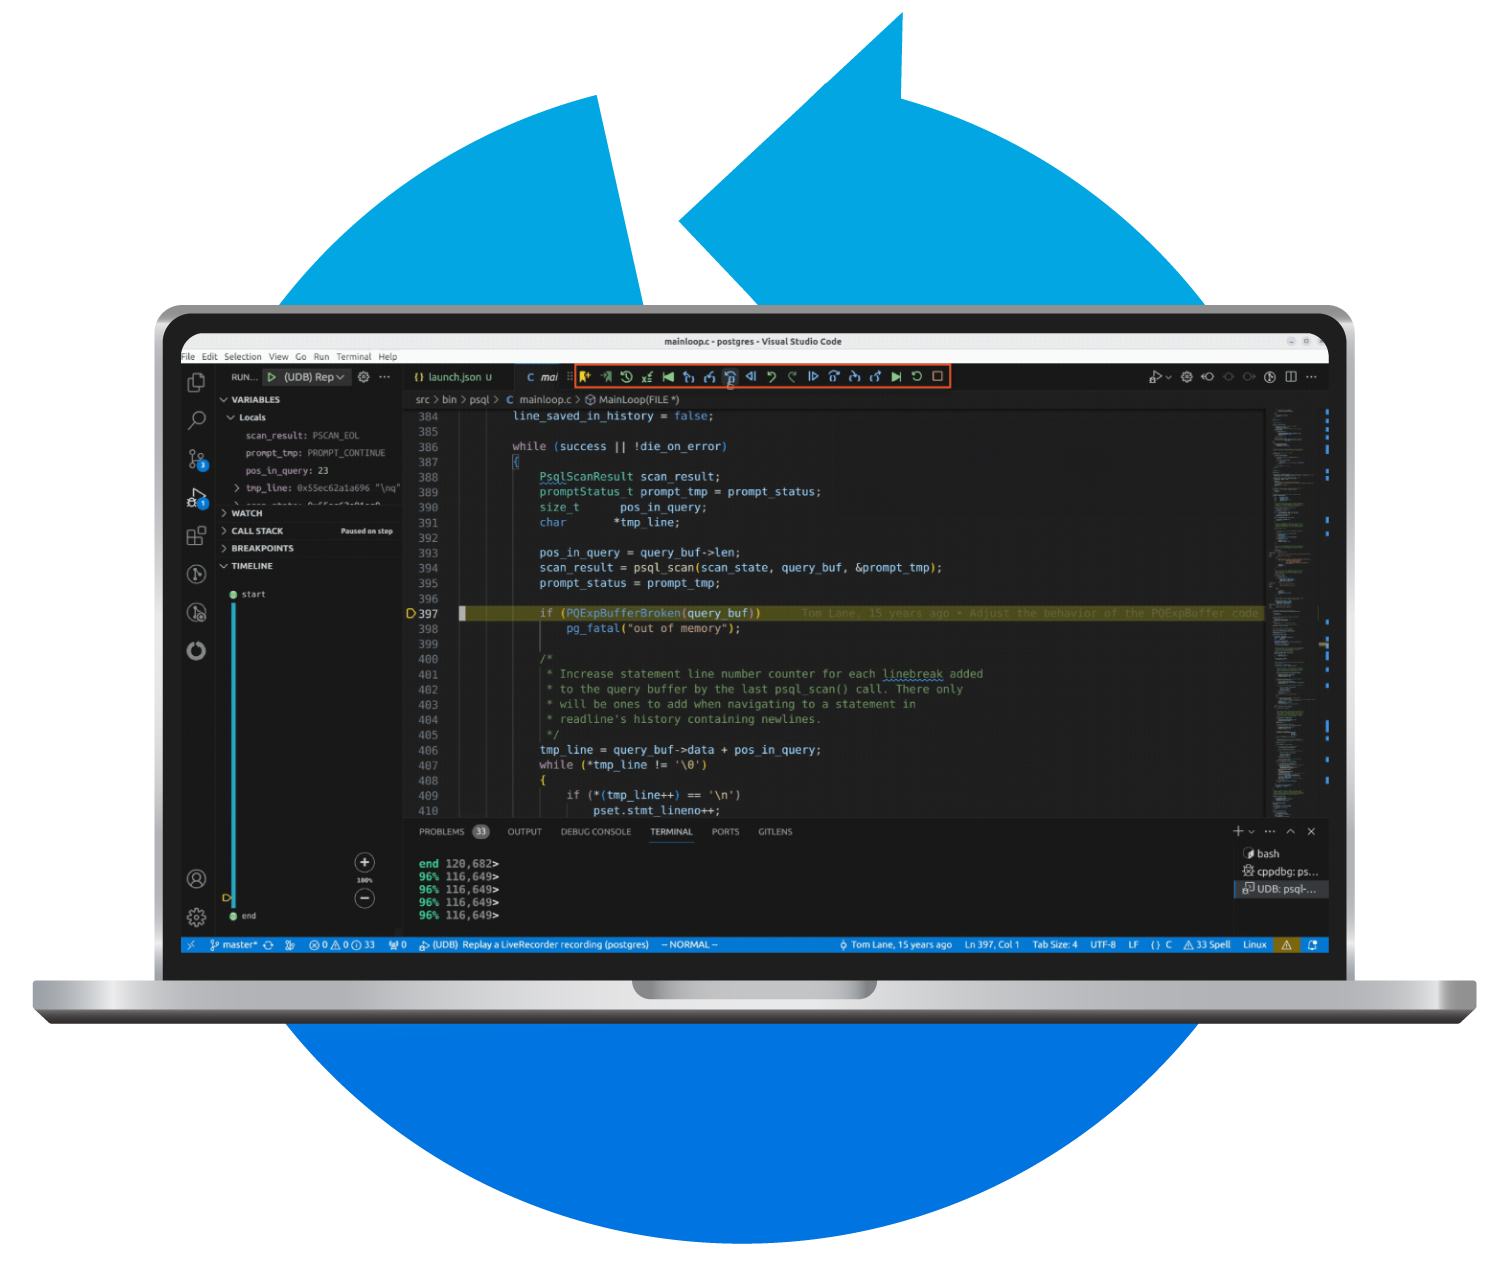
100% compatible with GDB so no need to learn a new tool – just a handful of new commands. Also available as a Visual Studio Code extension.
Resolve customer issues within hours by quickly getting a reproducer
Save time on diagnosing concurrency bugs caused by multithreading
Troubleshoot frustrating flaky tests producing inconsistent results
What is Time Travel Debugging?
Record a process. Replay the recording. Resolve the issue.
Reconstruct and examine the full state of the program at any point in time.
Step back in the execution history to inspect the code flow to see what happened.
Record
Replay
Resolve

Undo Bug Bounty
Think you can outsmart Undo?
Submit a recording of a bug we can’t solve with Undo and WIN a fully paid conference visit of your choice – up to $3,000!
- Step 1: Capture your bug in a recording using Undo. If you don’t have it, use the free trial.
- Step 2: Upload your recording below.
Need help to create a recording? No problem. Just book a quick call with one of engineers who can show you how to do it.
Solve your Hardest Bugs – Fast
- Diagnose memory corruptions, race conditions, and other complex intermittent bugs within days, not weeks or months
- Quickly rewind to the point of failure in the debugger to understand the root cause
- Run, step the program backward or forward, or jump immediately to any point in the execution history to see what happened – without having to restart the process again
Watch the Demo

Understand Code You Didn’t Write
Unfamiliar with the codebase? No problem! You don’t have to have it all in your head. Even for experienced developers, bugs in multi-million line codebases always involve something unfamiliar.
A recording captures the whole execution history – every line of code in every thread, every variable, every I/O. Rewind and fast-forward time to see how state changes and why the code behaves the way it does.
- Get a picture of code flow by exploring how the code is executed dynamically
- See exactly what happened and how it happened
- Understand subtle interactions amongst complex components, custom data structures, and confusing locking schemes
TRUSTED BY INDUSTRY LEADERS
Integrates with all popular CI / test automation tools and IDEs
Flexible APIs and CLI tooling make it easy to integrate with custom test environments too


