WatchPoint

Using GDB in Emacs to improve your debug experience
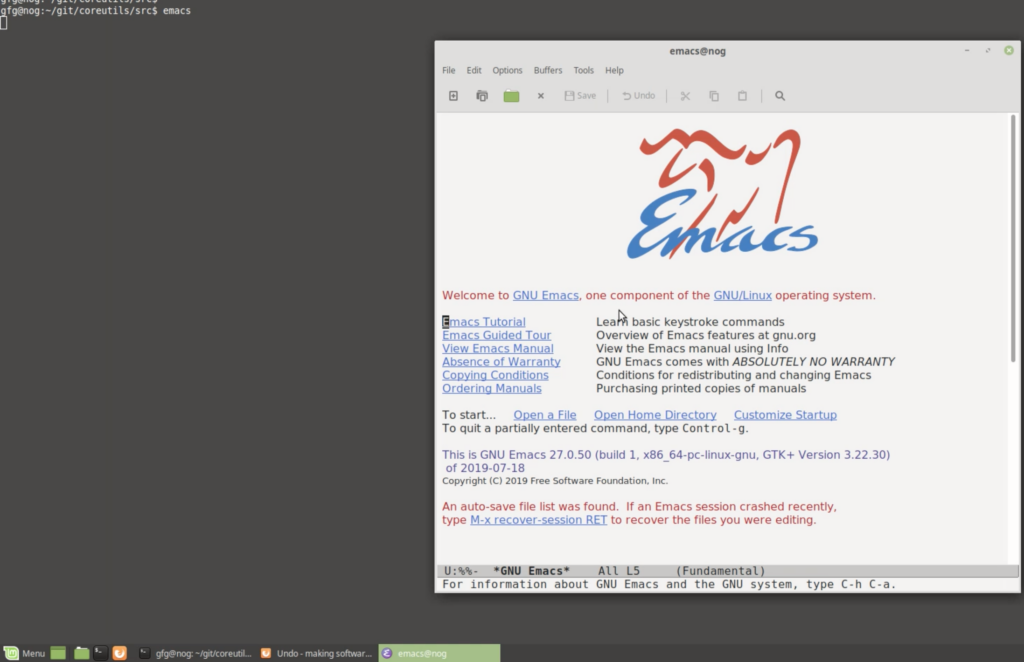
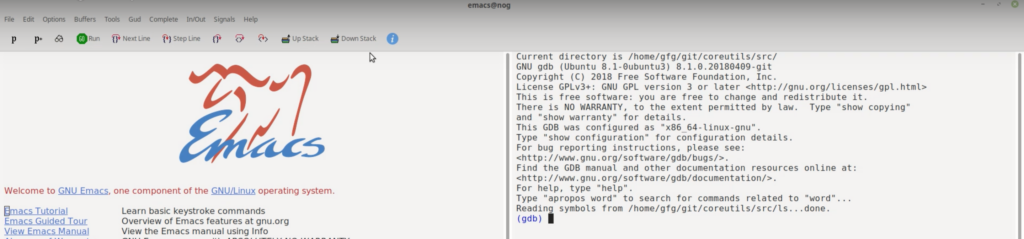
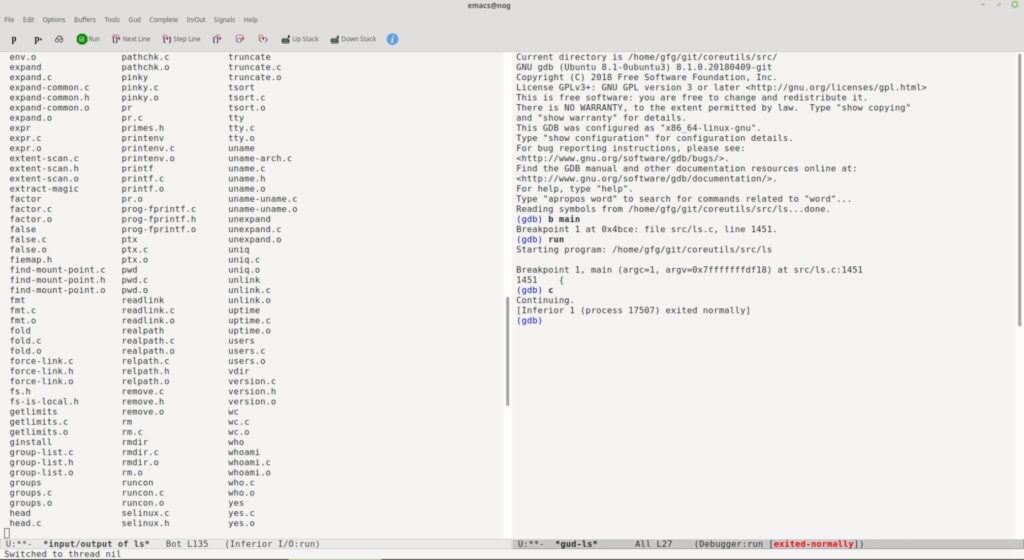
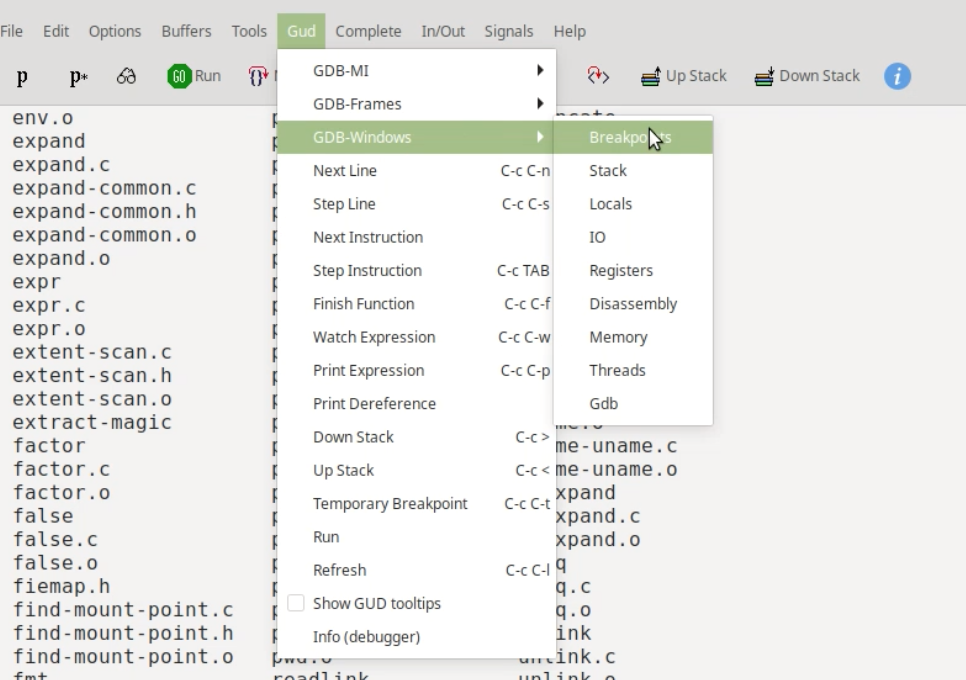
In this episode of gdbWatchPoint Finn Grimwood, a senior Software Engineer at Undo, shows how he uses GDB inside the Emacs editor. Hi – I’m Finn. In this episode of gdbWatchPoint, Greg has asked me to show you how to use Emacs and GDB, and some of the techniques to improve your debugging experience. You can start by just starting Emacs: In the minibuffer, type the command Hit return after which the minibuffer will show how to start gdb, which is more or less exactly what you’d type on the command line: (A useful thing to know here is that Hit return on the command in the minibuffer to start GDB inside Emacs. When running GDB inside Emacs, the IDE environment changes to suit Emacs. For example, the toolbar has changed to show the next/previous and up/down stack commands: Emacs also adapts the toolbar as you use it, adding and removing options to help your debugging experience. If I set a breakpoint at main and run GDB, Emacs automatically opens up the file at the breakpoint for you. You can then use the toolbar, which Emacs has customized, to navigate around the program. Another useful automatic feature is that if I continue the program to the end, the output is shown in a new Emacs window for input/output: This is really useful – Emacs separates out the source code, the program output, the interpreter into separate windows so you can navigate your program more easily. However, there’s even more that Emacs can show in separate windows by navigating to the GUD menu and then GDB-Windows option: All these views on the GDB process are really useful but it can start looking cluttered as you open up each window separately. I tend not to do this because there’s a better way of managing all these windows which is called To use this, open up the minibuffer and run: After this, you’re shown a much more organised, much neater layout which looks like something you’d expect from an IDE. This provides local registers, input/output, the source code and the GDB command which is much more useful than opening up each window individually. All these techniques are useful, but there is still a problem with this setup: it doesn’t persist over multiple Emacs sessions so if I quit and then go back into Emacs, my setup is lost which is really frustrating. To make GDB many windows persist you can do You’ll then find the many windows option and you can toggle it on and off. You’ll also find some other interesting options in here such as GDB Show main which displays the source file containing the main routine of the startup. Once you’ve done that, quit Emacs completely, restart it and start GDB again then all the useful windows have been reinstated. The GDB prompt, the source file, the local registers, locals, and breakpoints. As one final tip, you can set a GDB breakpoint in Emacs by clicking in the gutter by the line you want to set a breakpoint at. When you do a red dot appears. What you see in the video is almost exactly how I have GDB setup in Emacs for debugging. I hope this has been useful and see you again for the next gdbWatchPoint.Introduction
$ emacs
M-x gdb
gdb -i=mi ./ls
-i=mi tells GDB that it’s running inside an IDE.)
Emacs running GDB
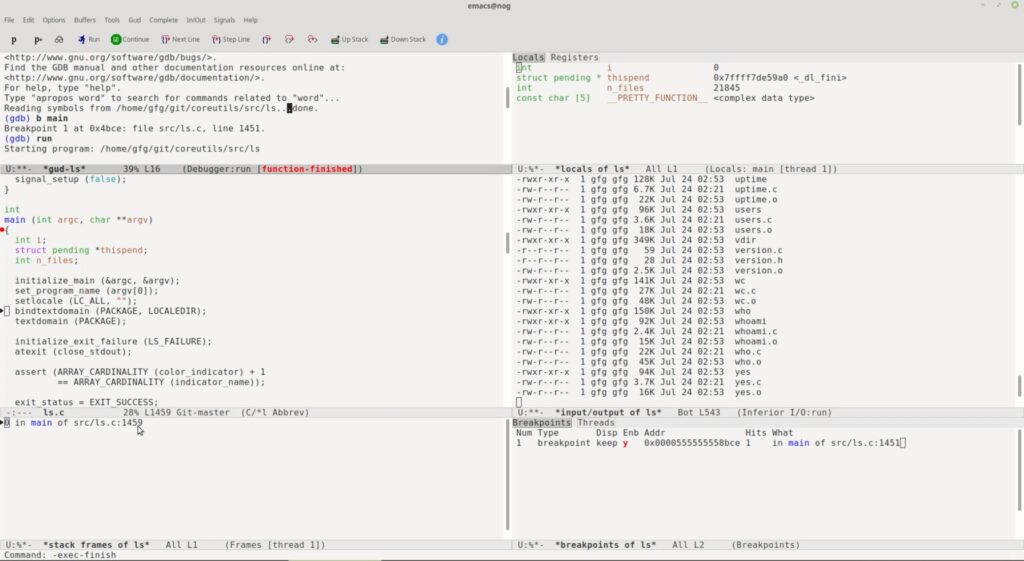
Multiple windows with GDB in Emacs
GDB Many Windows in Emacs
gdb-many-windows.gdb-many-windows
Optimising your GDB/Emacs setup
M-x customize. This opens up the Emacs config options which you can search for GDB: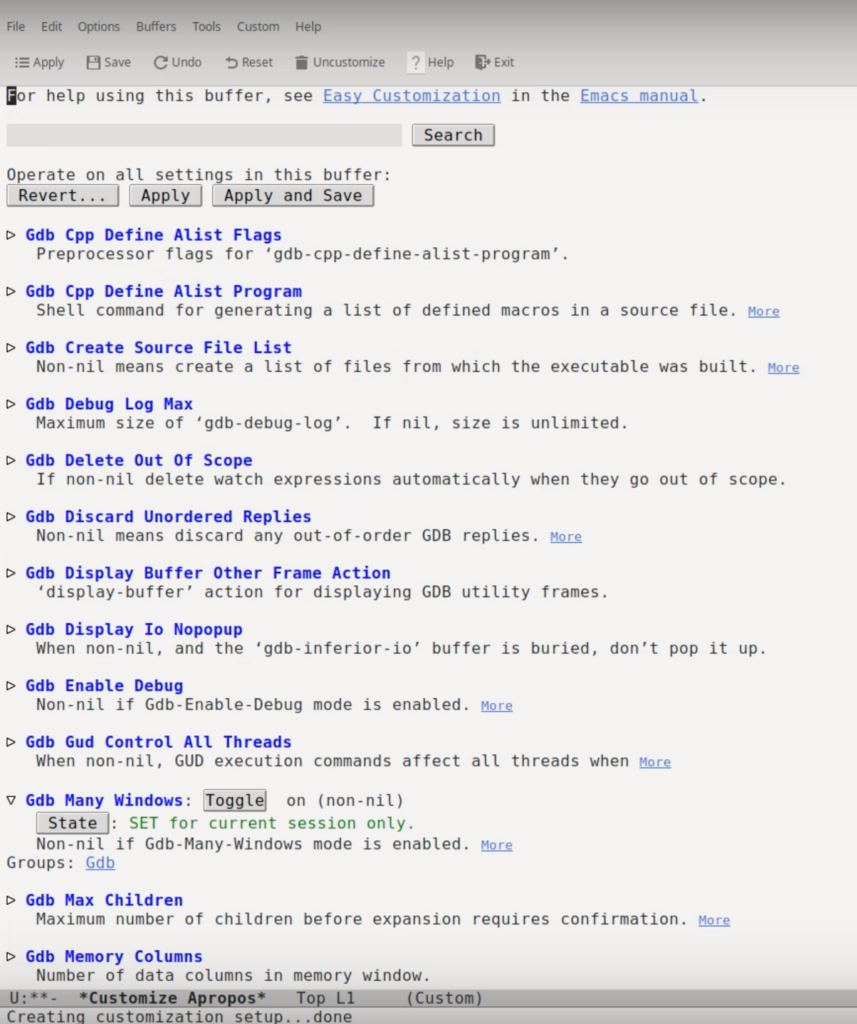
Setting breakpoints in GDB
GDB & Emacs

Want debugging tips directly in your inbox?
Share this tutorial