WatchPoint

A quick introduction to using Valgrind and AddressSanitizer
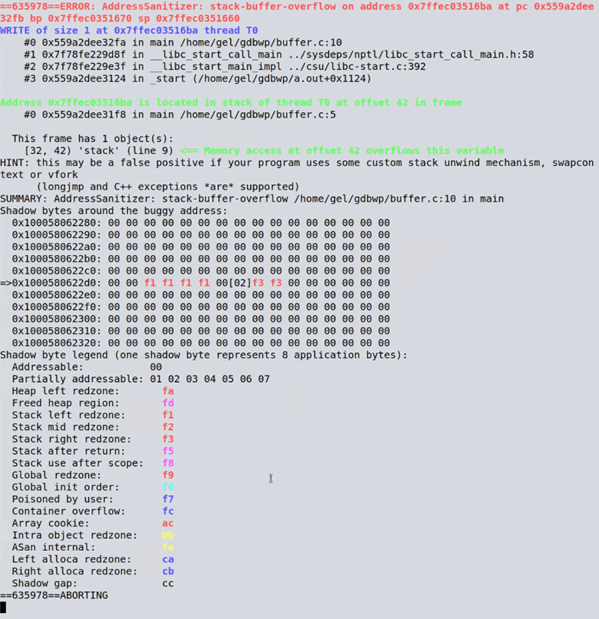
In the past we’ve mostly covered GDB, but today we’re going to cover two other powerful debugging tools: Valgrind and AddressSanitizer (ASan). In this tutorial, you’ll learn how to quickly and easily identify the source of buffer overruns using Valgrind’s Memcheck tool and AddressSanitizer, and see a brief comparison of the two tools. Let’s say we have a program It contains a buffer overflow – a fairly simple error where data is written to an out-of-bounds memory location. (Obviously, in this program there are no ill effects because there’s nothing else going on; but you can imagine in a real program this kind of error could have serious consequences and be much harder to locate.) If we compile the program and run it through Valgrind: And look at that! After waiting a few seconds it found the issue for us. It will slow down considerably – probably several orders of magnitude slower than the program running on its own – but it can still be super useful for locating memory errors you are looking for. As you can see, it nicely tells us that a memory error has been found, and the responsible line of code ( AddressSanitizer on the other hand, runs much faster. Unlike Valgrind though, you need to compile your program specially. The technology is built into GCC and Clang, and we use the Now when running the program, it gives you its colorful report: Again, it nicely tells us that there is a heap-buffer-overflow, the address it happened in, and the line of code that caused it. It does cause the program to run slower too, but with significantly less slowdown than Valgrind. Let’s take a look at the differences in how they operate. Valgrind does a “just-in-time binary translation”: as the program is executing, each basic block is being passed through Valgrind and translated to something functionally similar but with the Valgrind hooks. This works on an unmodified binary, which can be very useful if you don’t have the source code to hand but you know a program has a memory error. However, not adding checks at the compilation stage has some limitations – for example, let’s modify When running, the error is detected by default in this demo (when run it will report “stack smashing detected” and terminate the program – it’s possible in larger, more complex programs for errors like this to go undetected) so when compiling we’ll use the As before, Valgrind gives us a report of the memory errors it has found, and it has spotted one thing – that we’ve forgotten to free the heap that we allocated at the start. It doesn’t give us full details of memory leaks by default so you’ll need to use the As you can see, AddressSanitizer has spotted it, because it’s done in the compiler. The compiler knows the object was allocated on the stack, and it knows what its bounds are; it’s able to give a full report. Valgrind doesn’t have access to the source code, and so can’t detect things like this.In future articles, we’ll go into more depth about the features of these tools and some other tools, but hopefully from this tutorial you’ve got a nice, easy starting point for using Valgrind and AddressSanitizer.buffer.c:#include <stdlib.h>
int
main(void)
{
char *heap = malloc(10);
heap[10] = 1;
return 0;
}
$ gcc -g buffer.c
$ valgrind ./a.out
==30616== Memcheck, a memory error detector
==30616== Copyright (C) 2002-2017, and GNU GPL'd, by Julian Seward et al.
==30616== Using Valgrind-3.18.1 and LibVEX; rerun with -h for copyright info
==30616== Command: ./a.out
==30616==
==30616== Invalid write of size 1
==30616== at 0x10916B: main (buffer.c:7)
==30616==  Address 0x4aa504a is 0 bytes after a block of size 10 alloc'd
==30616== at 0x4848899: malloc (in /usr/libexec/valgrind/vgpreload_memcheck-amd64-linux.so)
==30616== by 0x10915E: main (buffer.c:6)
==30616==
==30616==
==30616== HEAP SUMMARY:
==30616== in use at exit: 10 bytes in 1 blocks
==30616==   total heap usage: 1 allocs, 0 frees, 10 bytes allocated
==30616==
==30616== LEAK SUMMARY:
==30616== definitely lost: 10 bytes in 1 blocks
==30616== indirectly lost: 0 bytes in 0 blocks
==30616==  possibly lost: 0 bytes in 0 blocks
==30616== still reachable: 0 bytes in 0 blocks
==30616==     suppressed: 0 bytes in 0 blocks
==30616== Rerun with --leak-check=full to see details of leaked memory
==30616==
==30616== For lists of detected and suppressed errors, rerun with: -s
==30616== ERROR SUMMARY: 1 errors from 1 contexts (suppressed: 0 from 0)
buffer.c:7).-fsanitize=address flag to use it (there are many kinds of sanitizer, but we’ll focus on address sanitizing today).$ gcc -fsanitize=address -g buffer.c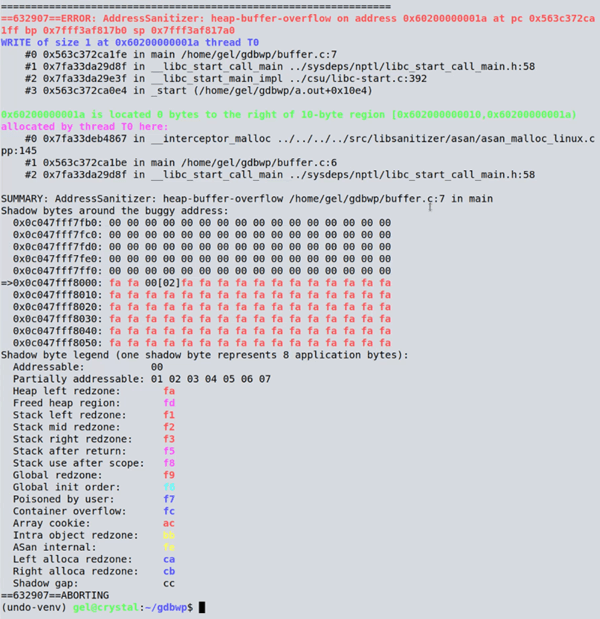
buffer.c:#include <stdlib.h>
int
main(void)
{
char *heap = malloc(10);
heap[9] = 1;
char stack[10];
stack[10] = 1;
return 0;
}
-fno-stack-protector flag, then run it through Valgrind.$ gcc -f -fno-stack-protector buffer.c
$ valgrind ./a.out
--leak-check=full flag to get the line that it occurred at. It doesn’t spot the stack buffer overflow, however. Let’s recompile the program with AddressSanitizer and run it again:$ gcc -fsanitize=address -g buffer.c
$ ./a.out

Get tutorials straight to your inbox
Become a GDB Power User. Get Greg’s debugging tips directly in your inbox every 2 weeks.
Want GDB pro tips directly in your inbox?
Share this tutorial