WatchPoint

Build for debug – help GDB commands you should know
Today we’re going to talk about how we build applications for best use inside GDB. Let’s talk about what the options The first option, If you are worried that adding However, when you compile with optimizations – with Let’s look at an example using this tiny little program: Compile it and run it inside GDB: Now if you Seen that before? You probably have. It’s somewhat annoying – partly because the message is somewhat misleading as it suggests the compiler has been super-clever and the value of foo doesn’t exist at all in your program; perhaps it’s been optimized away? This isn’t really the case. What this can mean is that the variable foo is not yet live at this point, even though notionally it’s in scope. In this example, we’re at the beginning of the line where this is declared, but space hasn’t yet been allocated for it. So, if I type Let’s look at what’s going on here and how the debugger does what it does. When we compile with Aside from the humor, what you need to know is that it’s a bunch of information generated by the compile that the debugger uses to understand what your program is doing. At its simplest, this debug information might be telling you what line you’re on. We can look at this using the This shows a dump version of the DWARF info which the compiler stored in In this dump, I can search for my variable Following on from that, there is information about its line, column, type and location. The location tells us where the variable is live. You can use the readelf utility to show the locations as so: What this shows me is a list of places where this variable is live; and from that I see that the program counter offset (highlighted below) is live in the register And what follows is seeing the variable flow through the program. If you return to GDB, go In short, It’s worth knowing that For example, while the default is This turns on basically everything and is likely to give you a better debugging experience. They are different versions of the DWARF format. The default for modern versions of gcc (with However, if you have to build on older systems to guarantee that the resulting application will run on older systems, then the compile will likely do a less good job at generating DWARF. This is because there’s a whole bunch of stuff it just can’t capture and you’ll see more “optimized out” annoyances when you’re debugging. But if you do have a modern compiler, For example, if you compile the following with …then run You’ll see that you’re told However, if you compile with Horrah! You can debug your macros. As a final point, here’s how to think about balancing optimization with debugging experience. You can specify Combined, the (The only reason not to use And there you go! Hopefully that’s given you some good tips and a deeper understanding of how you build your program for debugging with GDB. Try Time Travel Debugging for freeVideo
-g and -O
-g and -O do. The first thing you need to know is that they are completely orthogonal things.-g, compiles your program with the information to tell GDB what your program is doing. All the debug information goes in its own section in the executable or the object file and, importantly, it does not affect the code that is generated at all. On the other hand -O does affect the generated code, but does not do anything with debug information.-g will slow down your program, then don’t worry. This option will make your binary a bit larger on disk, but that’s it. Your program will run as normal and when you’re running the application, the operating system won’t even page in the additional debugging information into memory.-O – it can and often adversely affect your debug experience.Optimized out?
#include <stdio.h>
#include <stdlib.h>

int
main(void)
{
  int foo = rand();
  printf("foo is %d\n", foo++);
  return foo;
}
gcc -O3 -g optimized.c
gdb a.out
start and then print the value of foo, you’ll see:(gdb) print foo
$1 = <optimized out>
next and then look at foo … voilà, there is it:(gdb) print foo
$2 = 1804289384

Inspecting with readelf
-g, we’re actually generating dwarf information. (DWARF is a pun on ELF, which stands for Executable and Linking Format. DWARF goes with ELF.)readelf utility.readelf --debug-dump a.out | less
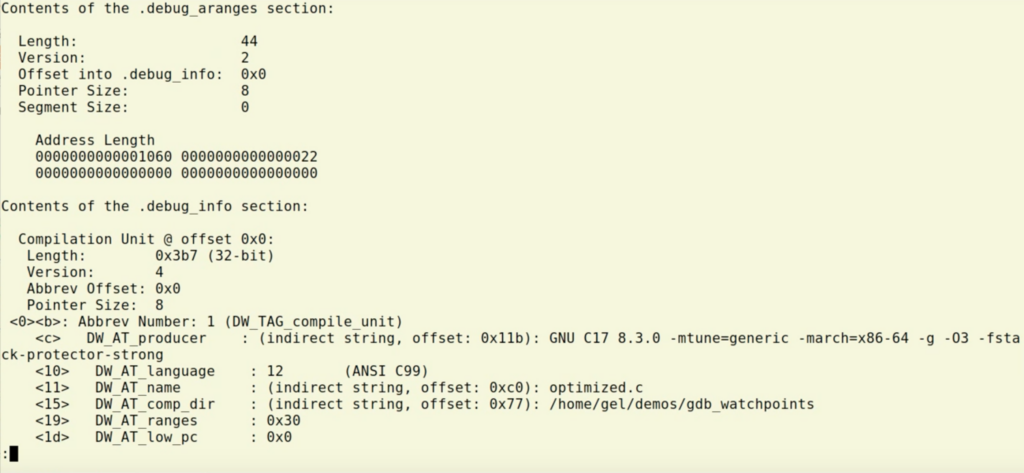
a.out along with your program.foo and see that the DWARF information is basically a tree. From this screenshot, you can see that foo is declared in file number 1 (the DW_AT_decl_file line underneath the DW_AT_name : foo line):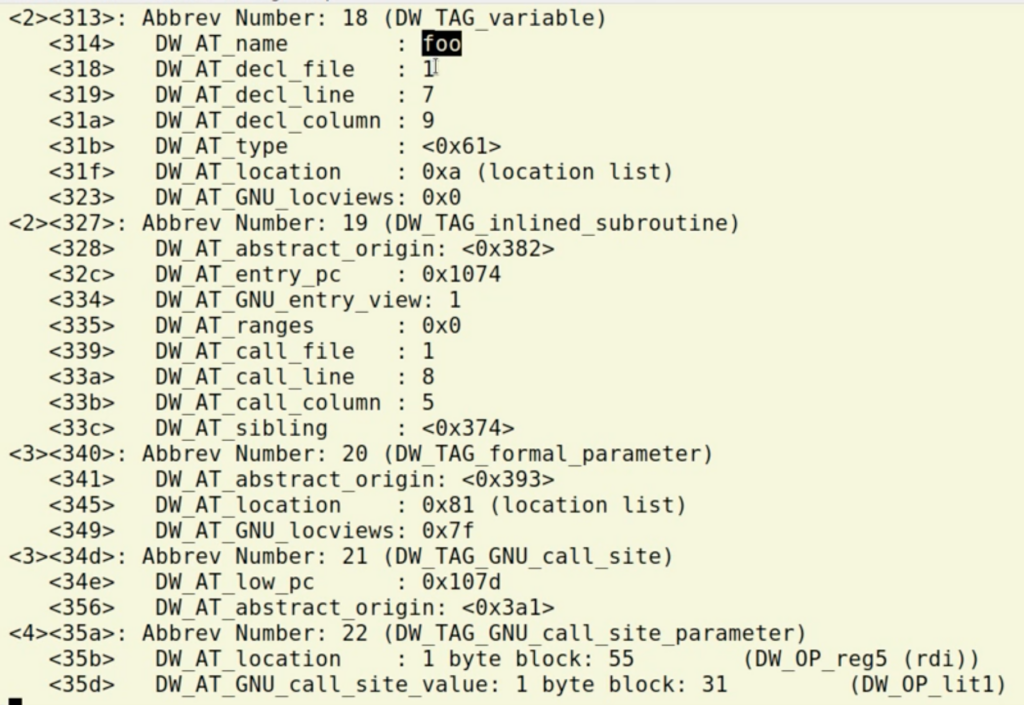
readelf --debug-dump=loc a.out | less
rax. It doesn’t exist in memory, there’s no address to look at, but we can see it’s in the register.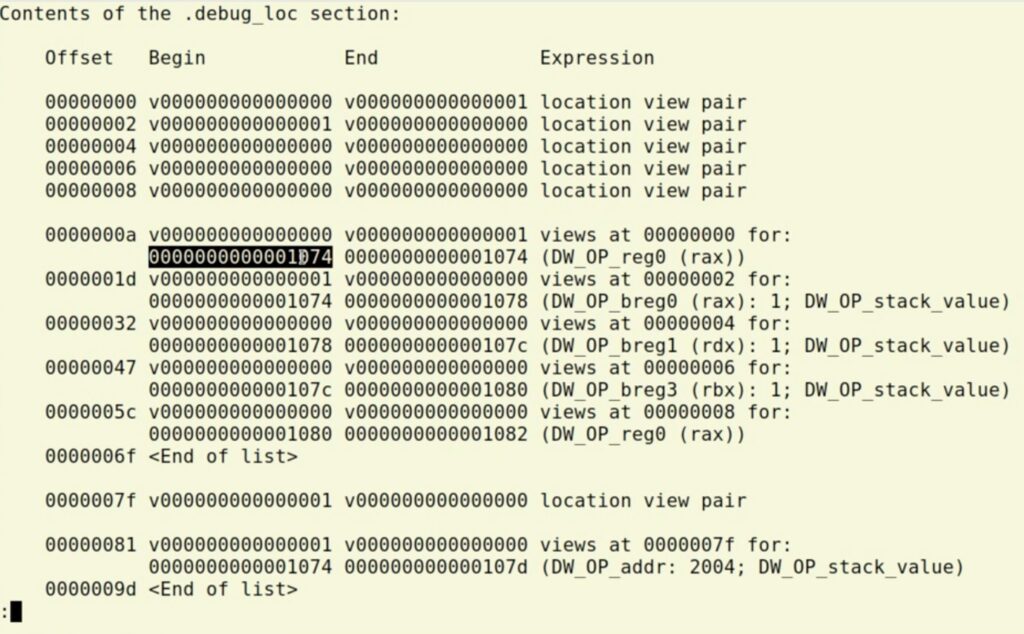
next and then print the program counter with print $pc, you will see the 074 in the location. (Watch the video above to see this in action.)<optimized out> doesn’t mean the variable isn’t there. Sometimes you can step next a few times. If you have reversible capabilities, you can back up to where it’s live.-g is not the only option
-g is not the only option that you can pass to gcc or clang about how it’s going to optimize data.-g2, if I pass -g3 which is the highest that will generate more debug information. This will make the binary larger, but it won’t of course affect the program itself.Different versions of DWARF
-g2) is to generate DWARF 4.-g3 will generate more than DWARF 4 including things like macros.gcc -g:#define VAL 42
int
main(void)
{
return VAL;
}
gdb a.out, open in GDB, run start and then do:(gdb) print VAL
VAL doesn’t exist. This is because VAL is a macro, so the compiler has never even seen it.-g3 and load into GDB, the same print line will show:$1 = 42
Option -Og
-Og will give you a good debug experience and remaining pretty fast.-g3 -Og options give you nice balance of performance but is still nicely debuggable.-g3 is if you’re really sensitive to the size of your binaries on disk or compile time of your code.)
Find and test failures in minutes with UDB – step backwards in time to view registers and memory
Learn more »
Want debugging tips directly in your inbox?
Share this tutorial