WatchPoint

Reduce binary size and compile time with split DWARF
This follows on from my video Build for Debug which looked at how to build your program for the best debugging experience with GDB. Check out that post to understand the difference between the Building programs to be debugged inside GDB can result in high binary size and increased compile times. In this post and screencast above, I cover how to build your program for debugging, while reducing binary size and compile time by using the split DWARF flag. UDB Time Travel Debugger I omitted to mention that when using I should also point out that the size impact can be significant. Even with Even with incremental builds, the linker still needs to read all of the debug information in order to do things like remove duplications, for example. One thing that you can do to ameliorate the increased file size and compile time is the split DWARF approach. For example, when using If you then list the resulting contents of the directory you’ll see a few extra files: You can see that the compiler has made It also means I can store them separately and easily ship my binary. While you can get a similar effect without the split DWARF hassle by doing: … which achieves the same thing with the two steps. The advantage of split DWARF is that if your compile times are a problem, you’re doing incremental builds and your link times are significant then that can be a big win. And there you go! Hopefully that bolstered your deeper understanding of how you build your program for debugging with GDB.Video
Building for debug
-g and -O flags, what <optimized out> really means, the different DWARF formats and more.
Step backwards in time to view registers and memory – find and fix bugs in minutes
Learn more »Build times and binary size
-g3, as well as producing larger binaries, it will take longer for the compile step as well. So, if longer build times are a problem for you, that’s something to consider.-g (which will default to level 2), 60% – 80% of your binary size will be the debug information. With -g3, this can as much as double.Using split-dwarf to reduce binary size
-g3 on an example program optimized.c:gcc -g3 -gsplit-dwarf -O3 optimized.c
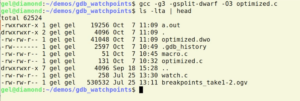
optimized.dwo which is where all my DWARF information has gone. So when I come to link the different objects together, if I’ve got an incremental build, the linker doesn’t need to worry about them.gcc -g3 -O3 optimized.c
cp a.out a.out.debuggable
strip a.out

Want debugging tips directly in your inbox?
Share this tutorial