WatchPoint

Debugging multithreaded code with GDB: thread names
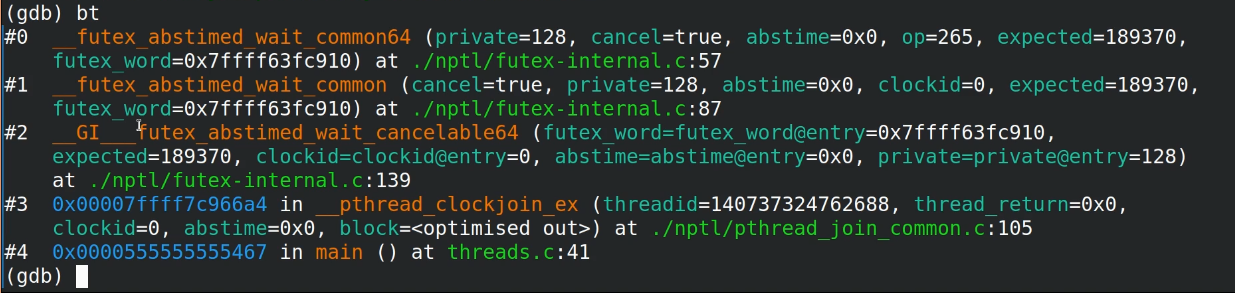
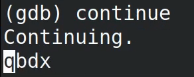
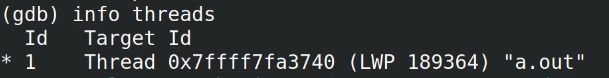
Threading bugs can be tricky to diagnose! Thankfully, GDB has some great functionality for helping to debug threads. In this tutorial, we’ll look at how to debug threads using GDB, along with some helpful examples. Here’s an example C program which uses threads: Compile it using This program creates 4 worker threads that spin, updating their entry, and outputting to the screen. To run gdb on our executable, run To run our program in gdb, type As you can see, GDB informs us that the 4 worker threads have appeared. To get more info about these threads, run Threads are referred to in GDB by their Id, seen on the left. The “Target Id” shows how the operating system sees the thread. With the pthread internal pointer and the LWP process Id (LWP stands for LightWeight Process and comes from Solaris – in Linux these are simply called threads, or tasks, and their id is known as a thread id, or tid). You can also see the names we gave the threads in the program. Any commands we give GDB will apply to the currently selected thread, for example a backtrace. If you were to continue from here, all threads would continue running. When interrupting GDB with ctrl-c, the thread we return to could be any of the 5 (1 main thread and 4 worker threads) depending on which thread receives the SIGINT signal. In practice, Linux seems to prefer the main thread receiving this signal, so you’ll usually end up back in thread 1. If you run When stepping a thread, all other threads are released to run while the stepped instruction or line is executing and are then stopped again when the instruction or line is completed. For example when running Even if you run This is the default behavior; however, if you want to see more specifically what a single thread is doing without all other threads changing, you can use Now if you step forward only the current thread will execute. The problem is that when stepping through our current thread it might try to take a lock that is held by another thread, and that other thread is not running, and so our current thread cannot continue, creating a deadlock. Even though our simple program here doesn’t have any locks, things like libc do, so you can easily find yourself in deadlock situations. This is why scheduler-locking isn’t on by default. You can circumvent this deadlock by changing the current thread to the one that holds the lock, and stepping that thread. Overall, if you know what you are doing, having scheduler-locking on can be very useful to finely debug complex threaded programs. There is a middle ground with scheduler-locking which you can use by running I sometimes hear people say that GDB is not very good for debugging multithreaded programs and that couldn’t be further from the truth. If you understand how the operating system uses threads and how GDB behaves when debugging threads, GDB is a great tool for debugging even the most complex threaded programs.Debugging threads with GDB
#include <pthread.h>
#define _GNU_SOURCE
#include <assert.h>
#include <pthread.h>
#include <stdio.h>#include <stdint.h>
#include <unistd.h>

char spinners[] = "aaaa";

static void *
looper(void *p)
{
 int idx = (intptr_t) p;
 while (1)
 {
 spinners[idx]++;
 if (spinners[idx] > 'z') spinners[idx] = 'a';

 printf("%s\r", spinners);
 fflush(stdout);
 }
}

int
main(void)
{
 int thread_count = 4;
 pthread_t threads[thread_count];
 for (intptr_t i = 0; i < thread_count; i++)
 {
  int e = pthread_create(&threads[0], NULL, looper, (void*)i);
  assert(!e);
    char name[64];
  snprintf(name, sizeof name, "worker%li", i);
  pthread_setname_np(threads[0], name);
 }
 for (int i = 0; i < thread_count; i++)
 {
  int e = pthread_join(threads[0], NULL);
  assert(!e);
 }
}
gcc -g3 threads.cgdb a.out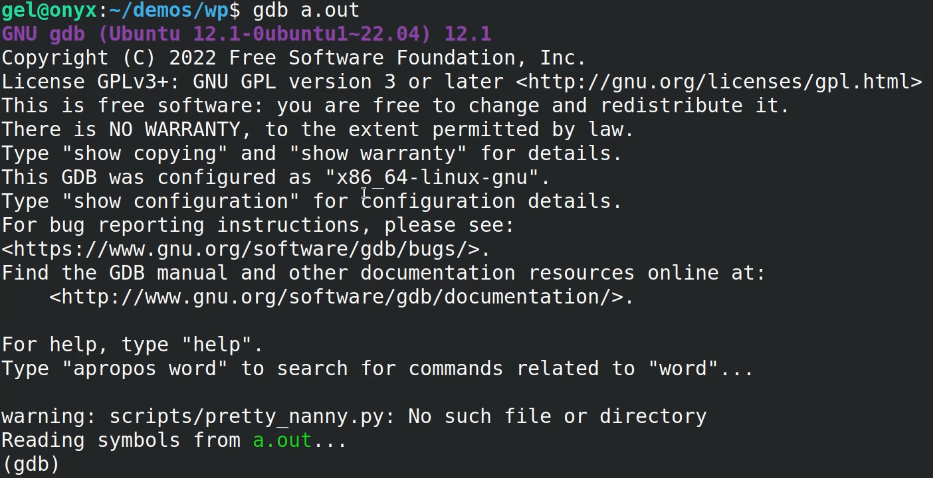
run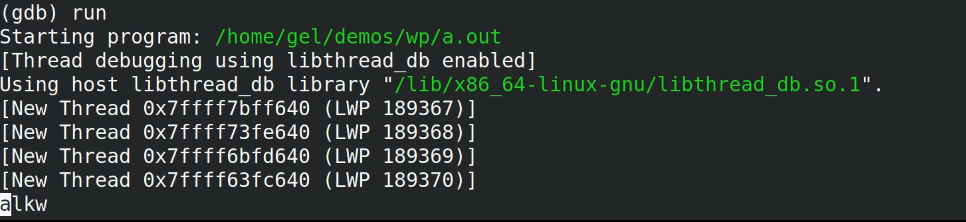
info threads.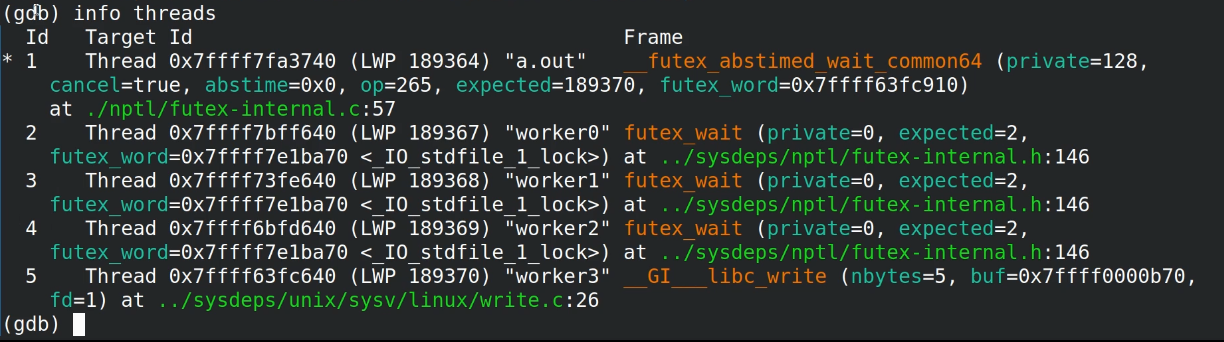
![]()
finish, it’ll try to run the selected thread until the current stack frame returns. In this example nothing will happen as thread 1 is constantly locked.next on thread 5 (the 4th worker thread), you can see that all other characters have changed by a significant amount.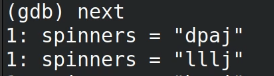
stepi (which is the smallest step you can perform in GDB) to step one instruction forward in the selected thread, all other characters have still changed by a significant amount.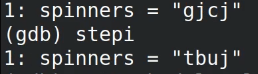
set scheduler-locking on to only allow the current thread to run.set scheduler-locking step. What this does is enable scheduler-locking when stepping through the program, but disables it when using continue.Summary

Get tutorials straight to your inbox
Become a GDB Power User. Get Greg’s debugging tips directly in your inbox every 2 weeks.
Want GDB pro tips directly in your inbox?
Share this tutorial