WatchPoint

How to Work with User-Defined Commands in GDB?
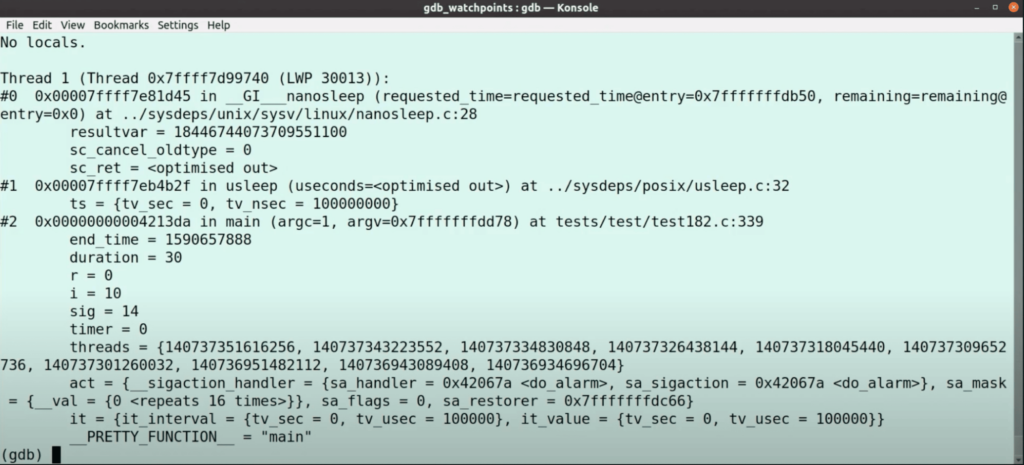
In this GDB tutorial, we’re going to look at user-defined commands. There are various reasons you might want to work with user-defined commands; but one of the most prominent is that we want to be productive. For example, if we’re doing something repetitive, then it’s good to automate it; we spend less time doing the task, and of course, we make fewer mistakes once we get it right. Two ways to automate things in GDB: Both options have their place. If you want to automate something simple quickly and perhaps just for that one debug-session, you can opt to do a user-defined command. If it’s complicated and requires more than a few lines of code to automate or something that you might want to check into source control and share with your teammates, you’re better off using Python. Coding your user-defined command in Python is more robust; it’s more extensible and generally a bit more work, but it gives you better results. In this GDB tutorial series, we explore both options. Let’s start with the most straightforward built-in user-defined commands. In my video example, I use a simple multithreaded program that runs for 30 seconds; but you can use your little test program instead. Imagine that your team institutes a new policy that requires you to attach certain information for every bug report you submit. In practice, you may not always remember what information to include, so let’s automate that. It kind of gets down to a full To create a user-defined command, we use the GDB command *Note that pagination stays off, and that can confuse users. To run the user-defined command, type the command name Now you can simply copy-paste the output and append it to your report. It would be more helpful if the output went straight into a file, true? So, let’s do that. Run it and display the file contents. Cool. There are a couple of useful things you might want to know with user-defined commands, particularly on the I will dedicate a GDB tutorial to the You can hook pretty much all GDB commands. So, for example, when you’re impatient (like me) and want to run your program, let’s say for only 3 seconds instead of its full runtime, you can do this with the Let’s define a If you run your program now, then it will run for precisely three seconds. You can do much more exciting things with the I hope you found something new to try out. Don’t forget to watch, subscribe, like, and share my video. Good luck debugging! <a/rticle>In this GDB tutorial
GDB versus the Python way
GDB built-in user-defined commands
backtrace for all the threads and uname -a. You probably want to capture a lot of other stuff too, but this will do for our example.define, and give it a command name, which in our example is bugreport followed by a set of GDB commands that you want to execute or capture the output from.(gdb) define bugreport
> set pagination off
> thread apply all backtrace full
> shell uname -a
> end
(gdb)
bugreport.(gdb) bugreport
(gdb) define bugreport
> set pagination off
> set logging file /tmp/bugreport.txt
> set logging on
> thread apply all backtrace full
> shell uname -a
> set logging off
> end
(gdb)
(gdb) bugreport
(gdb) shell cat /tmp/bugreport.txt
GDB hook command
hook command.hook command in part 3 of this user-defined command series, but below a sneak peek on what this GDB command can do for you.set arg command.hook command with this GDB command.(gdb) define hook - run
> set arg 3
> end
(gdb)
hook command, but I leave that for another tutorial.
Want debugging tips directly in your inbox?
Share this tutorial


