WatchPoint

Leveling up your GDB flow with CLion
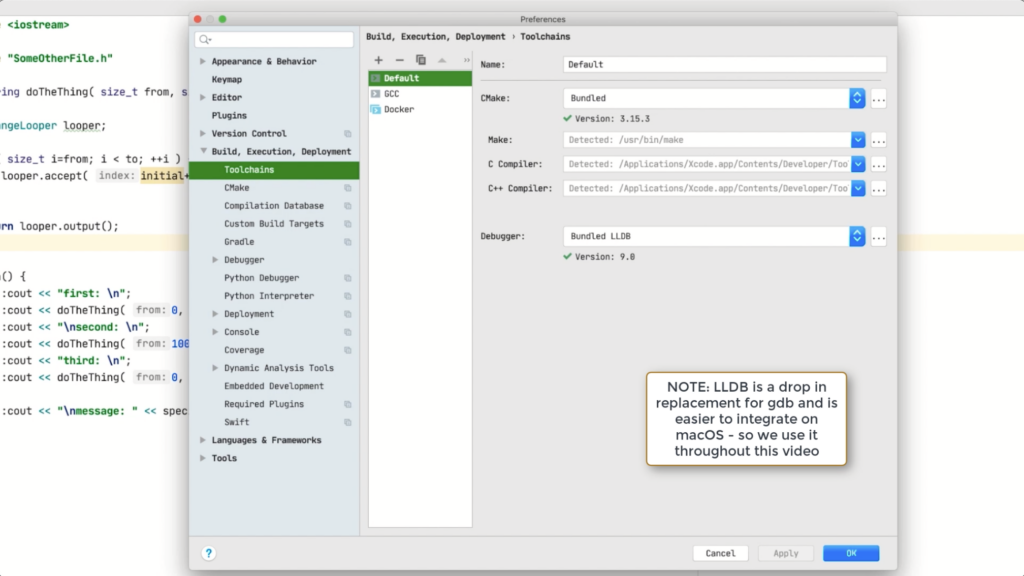
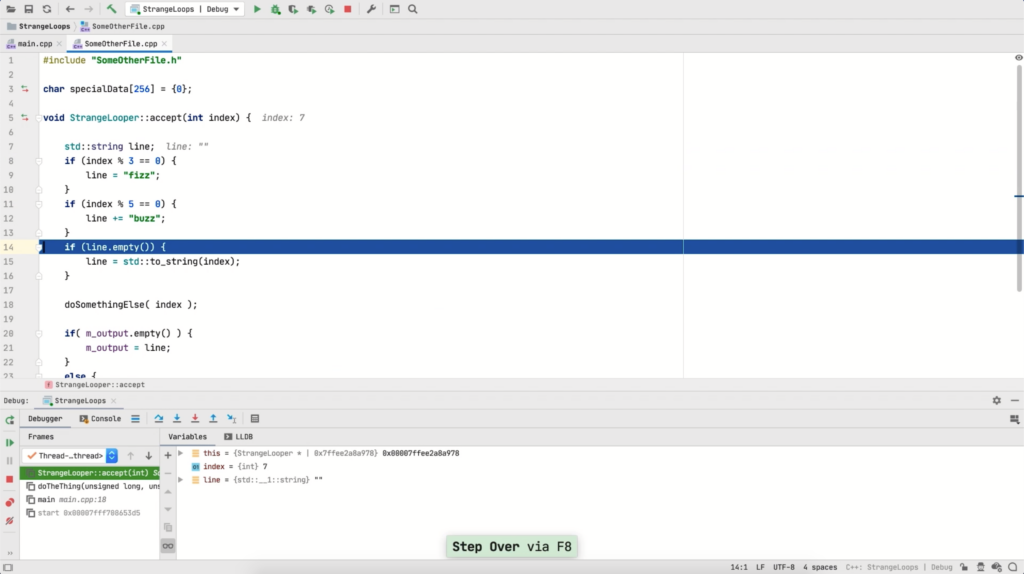
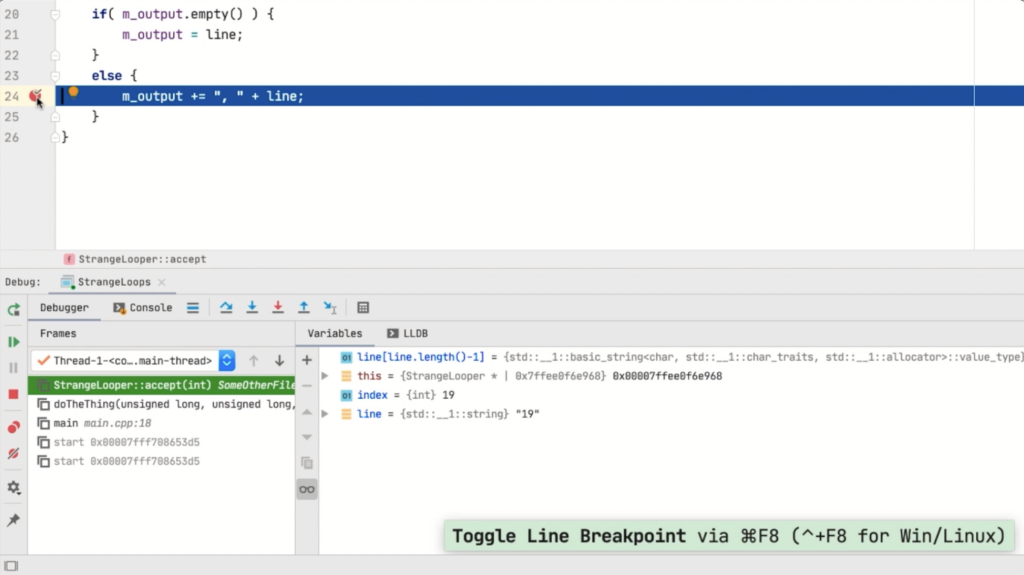
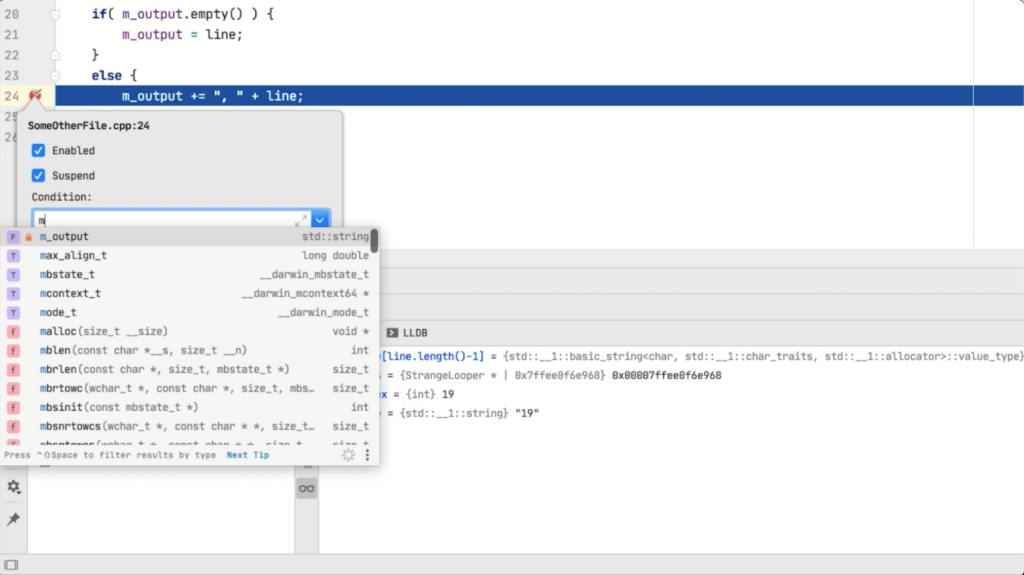
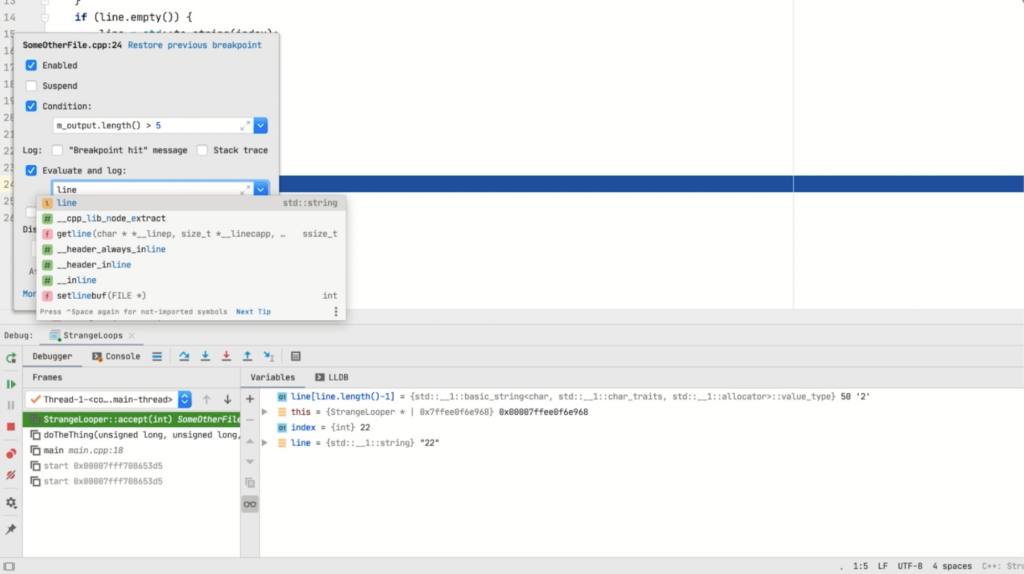
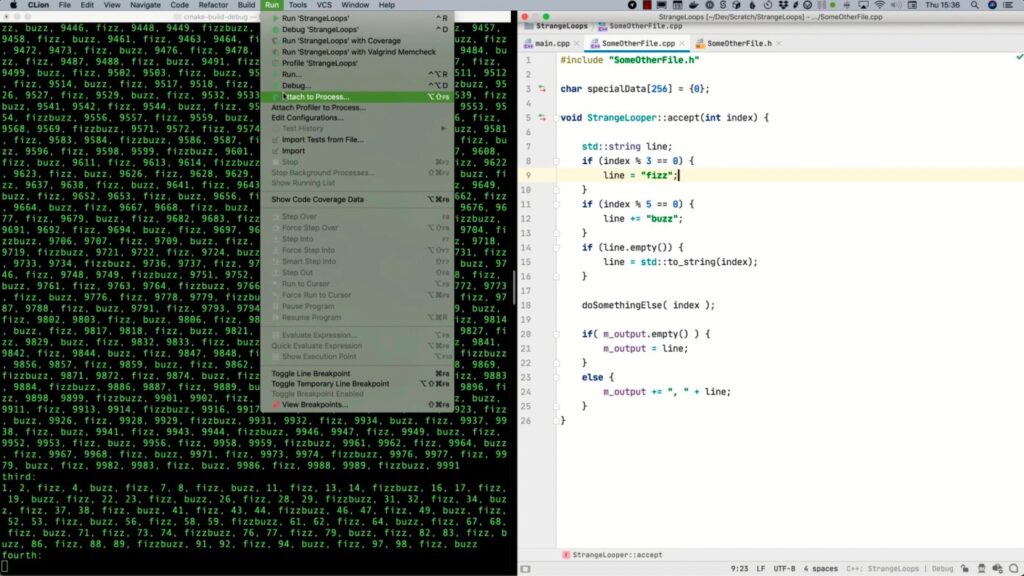
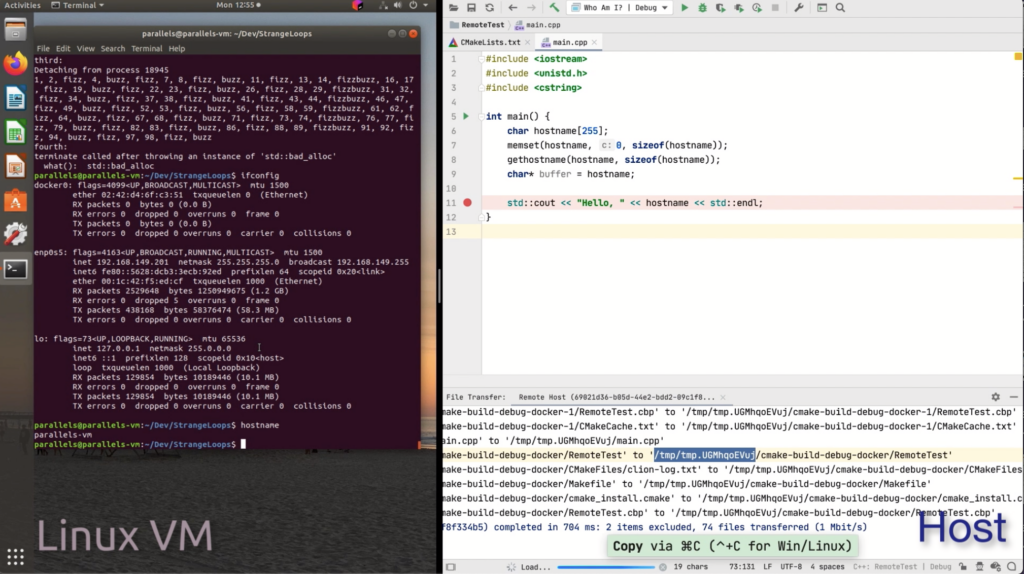
For this GDB tutorial, I invited my good friend Phil Nash to show CLion’s less known GDB command features. Phil is a developer at JetBrains. CLion is an Integrated Development Environment (IDE) for C and C++. GDB and LLDB fully integrate with CLion. You may not even know that GDB runs under the hood, so I thought that this is an excellent opportunity to explore how you can optimally leverage GDB in CLion. Over to you Phil. As Greg said, you may not even know that GDB or LLDB runs under the hood. CLion most likely picked up your toolchain when you installed it. If you need to set it up or make changes to your toolchain, then you can do that in settings. You can even add more toolchains, and switch between them. CLion offers all the fundamentals, such as setting breakpoints, stepping into or out of code, and inspecting variables. But if you’re a GDB expert, you’ll be pleased to know that you still have full access to the GDB console at any time. A quick note, LLDB is a drop-in replacement for GDB, and it is easier to integrate on macOS, so I use it throughout the video. Where debugging in CLion really shines though, is where it goes beyond the basics. For example, in addition to the standard variable inspector pane, variable values are also shown inline alongside your source code – giving you a much more integrated experience, and keeping you in your debugging flow. In other cases, CLion exposes the more advanced GDB command features. For example, it can evaluate a complex expression, even if it involves function calls. You can declare your variables, just scoped within your evaluation, and even change the state in the program directly or inside the function call. You can add these complex expressions as watches so that you can reevaluate them on every step. You can do more with breakpoints too. UDB Time Travel Debugger CLion shows a breakpoint as a red dot in the gutter. You can turn a breakpoint on and off by ticking the dot or simply use the short-cut. If you right-click a breakpoint, you’ll get more options. You can disable a breakpoint, which is handy if you don’t want to remove it entirely, but stop it from doing anything for now. You can get a breakpoint to break conditionally based on the evaluation of a single value or an expression. You can also set a conditional breakpoint to suspend the execution. That seems odd. Why would you want a breakpoint if it doesn’t break? Let’s look into that. You can get a conditional breakpoint to log things, show a message, stack trace, or use the result of another expression evaluation. This is useful if you want to see how a specific state is changing without stopping the program from running. You can also get it to fire only once by setting remove once hit, or the other way around, keep the breakpoint disabled until it reaches another breakpoint first. It’s important to remember that breakpoints don’t have to break or suspend so that you can set one to act as a dependency for another breakpoint later. That is useful if your code executes a lot, but you only want to debug when it traverses a particular code path. You can do even more. You can go through the general breakpoint dialogue. You can see all the breakpoints in your project and click through to them. And, if you have plugins for other languages like Javascript or Python, then you can set breakpoints for code in those languages too. There’s another type of breakpoint that CLion supports, the watchpoint. In CLion, a watchpoint triggers on data rather than code. You can set a watchpoint to fire when a variable is read from, written to, or either. That’s useful if you don’t know what line causes the problematic change, merely that the data changes. It’s common to start the execution of your program in the GDB, but in CLion, you can also attach it to an already running process. To do so, CLion gives you an attach to process command, which shows you a list of running processes from which you can pick. You can easily filter the list just by typing. This filter can come in handy especially when the process list gets long. Once you attached a program, the debugger works just the same way as before. Finally, let’s look at how CLion supports debugging on a remote machine. In CLion, there are various ways to do remote development; but for debugging purposes, it boils down to either connecting to the GDB server on the remote machine, local mode, or in full remote mode. In remote mode, you build and deploy over SSH, and CLion takes care of syncing the source files. Note that this remote mode works for Docker containers and many other embedded toolchains too. Debugging and solving problems in the tool that you also use to code your program, helps you write better software programs much faster. CLion is definitely an IDE to consider if you seek to level up your code writing. In this GDB tutorial, I showed you just some of the less known GDB features in CLion. But there are many things I didn’t explore. One of them is that CLion can also integrate with UDB (formerly known as UndoDB) via a plugin for reverse-debugging capability. I hope you found something new to try out. Don’t forget to watch, subscribe, like, and share my YouTube video. Good luck debugging. UDB Time Travel DebuggerIn this Tutorial
Integrated debugger
Going beyond the basics
Find and fix test failures in minutes – including C/C++ concurrency issues
Learn more »Do more with breakpoints
Watchpoints set on data rather than code

Attach CLion to a running program
Remote modes for debugging
Level up your code writing with CLion
Find and fix test failures in minutes – including C/C++ concurrency issues
Learn more »
Want debugging tips directly in your inbox?
Share this tutorial