
Resources
How I debug Python code with a Time Travel Debugger
Time travel is the biggest thing to happen to debuggers in decades. Traditionally debuggers have let you see what a program is doing; the new breed of time travel debuggers let you see what the program has done: you can wind back to see any line of code that executed and any variable’s value at any point in history. No more guesswork, no more trial and error. Users report improving debug capability by 10x or even 100x. It’s not just a question of being more productive; now bugs that previously just would not have been fixed are being fixed. It’s also much easier to work on a codebase with which you are unfamiliar. We now have industrial-strength time travel debugging for most commonly-used languages: C/C++, Java, Javascript, Go, C#, Rust – even FORTRAN and COBOL! But as yet, nothing natively for Python. There are several Python debuggers available out there, but none of them have time travel capability like UDB. This article presents how I use time travel to debug Python code, but first we’ll have a look at why the standard Python debugger is incompatible.
The standard Python debugger
Python ships with a debugger called pdb that lets you interact with your program while it is running – i.e. so that you can see in detail what it’s doing. Using pdb is as simple as calling the builtin breakpoint() function which drops you into a debugger prompt, and from there you have access to commands for evaluating expressions, navigating the call stack, stepping through the code and setting up conditional breakpoints.
Debuggers like pdb work by running inside of the same Python interpreter as the program that is being executed. This makes it easy to inspect and manipulate objects, as the debugger can directly evaluate expressions and access Python’s traceback and introspection modules. However, this also rules out certain debugging workflows.
Time travel debuggers like UDB and rr work on the principle of first recording a program while it is running normally, and then replaying the execution while allowing the user to navigate and inspect state at different points in time. They work at the process level — rewinding and replaying the state of the entire Linux (or Windows) process. While the program is being replayed it must follow the exact same path of execution as it took when it was recorded, and this prevents a debugger like pdb from being able to run at replay time Python functions that weren’t already executed at record time.
Technically, UDB does allow new code paths to be executed at replay-time, but these executions are isolated and all side-effects are discarded, so even if we were able to run code from the pdb module we wouldn’t be able to use features such as setting breakpoints.
Crash dumps like core files are also not compatible with pdb, because there is no live process in which to execute the pdb Python code.
What can we use instead?
A running Python program is ultimately just a process, so you can attach GDB (or UDB) to it. When debugging a Python process with GDB (or UDB) directly we are effectively debugging the cpython interpreter.
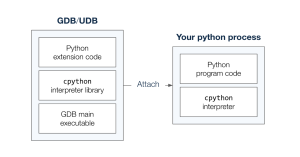
The debugger isn’t aware of any of the Python functions or variables inside our program. Luckily, the cpython project maintains a library of GDB extensions that give GDB the ability to understand Python code. The libpython.py library knows how to inspect the internal structures of cpython in order to present the state of the Python program to the user. The library is executed by a cpython interpreter inside the debugger process, meaning that no Python code needs to be executed inside the context of the program itself.
As the interpreter is implemented in the C programming language we must have DWARF debug information available for the Python executable for this to work, i.e the python executable must have been built with the -g compiler flag. Many modern Linux distributions come configured with a debuginfod service, in which case the debug information should be downloaded automatically. Otherwise, you may have to download a separate package with debug information.
Pretty printers
The libpython.py library defines a number of GDB pretty-printers that let GDB present cpython objects as Python values instead of C language values. For example, a Python object is stored as the generic PyObject type which is usually presented as a normal struct with fields.
> p filename
$1 = (PyObject *) 0x7f7f154aa610
> p *filename
$2 = {ob_refcnt = 10, ob_type = 0x7f7f16eb2f40 }
After sourcing libpython.py into GDB, this unicode string object is instead presented as a quoted string, just like we’re used to from the Python REPL. Note that we don’t even have to dereference the pointer.
> source ./libpython.py
> p filename
$3 = '/home/mhov/python-debugging/./race.py'
Already this is much more debuggable! Pretty-printers are applied automatically — there’s no need to specify that the cpython variable that you are trying to print represents a Python variable. These pretty printers also make it easier to read a backtrace of cpython as the Python frame objects are nicely formatted.
> bt 2
#0 _PyEval_EvalFrameDefault (tstate=, f=, throwflag=) at ./Python-3.10.12/Python/ceval.c:1848
#1 0x00007f7f16a6d226 in _PyEval_EvalFrame (throwflag=0, f=Frame 0x7f7f15567a40, for file /home/mhov/python-debugging/./race.py, line 54, in do_some_prints (x=3), tstate=0x114cc60) at ./Python-3.10.12/Include/internal/pycore_ceval.h:46
Backtraces
There’s a number of new commands for manually inspecting Python state. The py-bt command displays a Python backtrace in the standard Python traceback format.
> py-bt
Traceback (most recent call first):
  File "/home/mhov/python-debugging/./race.py", line 54, in do_some_prints
    y = 4
  File "/home/mhov/python-debugging/./race.py", line 60, in main
    do_some_prints()
  File "/home/mhov/python-debugging/./race.py", line 85, in
    main()
There’s also a py-bt-full variant which shows a few more pieces of information, including frame numbers corresponding to the cpython frames, the addresses of each Python frame object, and arguments for the Python functions.
Source code
The py-list command shows the current source code and the current position as indicated with the > character next to the line numbers.
> py-list
  49        	print(name)
  50
  51
  52	def do_some_prints():
  53    	x = 3
 >54    	y = 4
  55    	print(f"Hello from a function call: {x+y=}")
  56
  57
  58	def main():
  59    	print('Issuing a "print" statement')
The py-list command will present the source code and current position in your currently selected frame, meaning you can use the py-up and py-down commands in combination with py-list to navigate the source code along the whole call chain.
Variables
We previously saw how the print command has the ability to display Python values, but to do so we had to specify a Python object in terms of a cpython expression. Instead, what we really want to do is to specify the name of the Python variable, and the new py-print command lets us do this. Instead of considering the symbols from cpython it looks up the name of the variable inside of the currently active Python scopes (local, global and builtin).
> py-print x
local 'x' = 3

> py-print lock
global 'lock' = <_thread.lock at remote 0x7f7f15396240>
The py-locals command will show you all the variables that are available in the currently selected local scope and you can select different scopes with the py-up and py-down commands.
> py-locals
x = 3
y = 4
By using a combination of these commands you should be able to understand what the current state of your Python program is — even across threads! However, the main benefit of using a Time Travel debugger comes from being able to step or run your program forwards or backwards to see how the state of your program develops over time.
Navigation
Within UDB we have access to the regular navigation commands such as next, reverse-step and finish, but these operate on the cpython interpreter and not the Python source code. If we want to move around in the Python code we’ll have to implement some new commands ourselves.
Function calls
In the rest of this guide we’ll be extending libpython.py with some new functionality. Check out the repository at https://github.com/undoio/python-debugging/tree/blog-post-2024-01-18 for the full code.
One way to navigate Python code is to move between different function calls, and in order to know when cpython starts executing a Python function we need to hook into the appropriate cpython routines.
There’s a number of different routines available to invoke callables in Python:
- Builtin Python functions are typically implemented as C functions. We can hook into those by intercepting the
cfunction_enter_callC function. - Normal Python functions are compiled into Python bytecode which is then evaluated as separate frames. Unless you’re doing something funky these end up going through the
_PyEval_EvalFrameDefaultC function.
After setting breakpoints on these two cpython functions we can run our program forwards and backwards with continue and reverse-continue. However, what we really want is to be able to specify which Python function we would like to stop on. In order to achieve that we need to borrow and extend some of the logic in libpython.py to make our breakpoints conditional.
The following code implements two commands for advancing forwards and backwards to a specific Python function:
Now we can easily get to the start of our program by issuing the command py-advance-function main or the command py-reverse-advance-function main, depending on where we are in history.
Stepping bytecodes
Being able to navigate between function calls is great, but what if we want to go somewhere else, like stepping through each line of source code? By the time the interpreter executes our Python code it doesn’t really operate on source lines anymore, instead we have individual instructions of Python bytecode being executed by the bytecode interpreter loop (_PyEval_EvalFrameDefault).
By placing a breakpoint inside the interpreter loop we can step one bytecode instruction at a time. This isn’t as convenient as stepping source lines, but it is a lot easier to implement with the extensions that are already available to us.
The following code implements two commands, py-step and py-reverse-step, for stepping individual bytecode instructions forwards and backwards:
If we are going to step bytecode instructions then we will also need a way to see which bytecode instruction we are currently executing. With a little bit of plumbing we are able to fetch the bytes out of the interpreter state and disassemble it with Python’s disassembler module.
The following code implements a py-dis command which shows the bytecode of the currently selected Python frame:
The command indicates the current bytecode instruction, and includes the names of constants, arguments and variables that are referenced by the instructions.
 > py-dis
      	0 LOAD_CONST           	1 (3)
      	2 STORE_FAST           	0 (x)
      	4 LOAD_CONST           	2 (4)
      	6 STORE_FAST           	1 (y)
      	8 LOAD_GLOBAL          	0 (print)
-->  	10 LOAD_CONST           3 ('Hello from a function call: x+y=')
     	12 LOAD_FAST            0 (x)
     	14 LOAD_FAST            1 (y)
     	16 BINARY_ADD
     	18 FORMAT_VALUE         2 (repr)
     	20 BUILD_STRING         2
     	22 CALL_FUNCTION        1
     	24 POP_TOP
     	26 LOAD_CONST           0 (None)
     	28 RETURN_VALUE
Tracking value changes
One of the most useful features of UDB is the ability to search backwards for changes to data by using watchpoints or the last command. That is, if when debugging you see some piece of state that looks wrong (or you’re just generally curious about when that state got changed) you can wind back immediately to the line of code that most recently updated that value. It is an incredibly powerful capability.
In order to achieve the same thing for Python our extensions need to understand how Python objects are manipulated under the hood. Support for tracking changes to object attributes can be achieved by intercepting the PyObject_SetAttr C function.
The following code implements a py-last-attr command which searches backwards (or forwards) in time for the last time a given attribute name was assigned on a given Python object:
User Interface
Now that we have some means of getting around our Python program we could start exploring some actual code, but first let’s see if we can improve the user interface.
These days it’s fairly straightforward to extend GDB’s Text-User-Interface (TUI) mode with new types of windows. After a bit of plumbing, all we need to do is define a get_lines() method that can provide the content for our TUI window.
class MyWindow(Window):
    title = "My Window"

    def get_lines(self):
       return "This is the content in my new window"
Let’s create a new layout that can show us the output of these Python commands automatically. The following file implements a new TUI layout that shows the output of py-bt, py-locals, py-dis and py-list.
The layout can be enabled like any other TUI layout — with the layout command.
> layout python
The following screen recording demonstrates what some of these commands and the user interface components look like when used on an example program (don’t forget to view in full screen):

(https://asciinema.org/a/4sxAEWhqFI8rJF4atfsXQskYu)
Getting started
If you want to try this yourself, you can get started by heading over to https://github.com/undoio/python-debugging/tree/blog-post-2024-01-18 and reading the README.md file. Check out https://undo.io/udb-free-trial for a free trial version of UDB if you don’t already have access to UDB. The included race.py example Python program contains some simple function calls as well as a concurrency issue involving multiple threads.
These extensions are built for Python 3.10, so you might find that they don’t work as well for other Python versions.
If your Python source code doesn’t show up automatically, you might have to use the py-substitute-path command to let the debugger know how to find your local checkout of the Python source code.
Author: Magne Hov, Software Engineer at Undo