Resources
Time Travel Debugging for High-Level Synthesis (HLS) Models
Author: Jonathan Bonsor-Matthews held software and silicon engineering and leadership positions at Broadcom, AMD and Argon Design, and founded LightBlue Logic
This article sets out how time travel debugging is a multiplier effect for High-Level Synthesis (HLS), further enhancing time-to-market, productivity, coverage, and Power, Performance, Area (PPA) benefits.
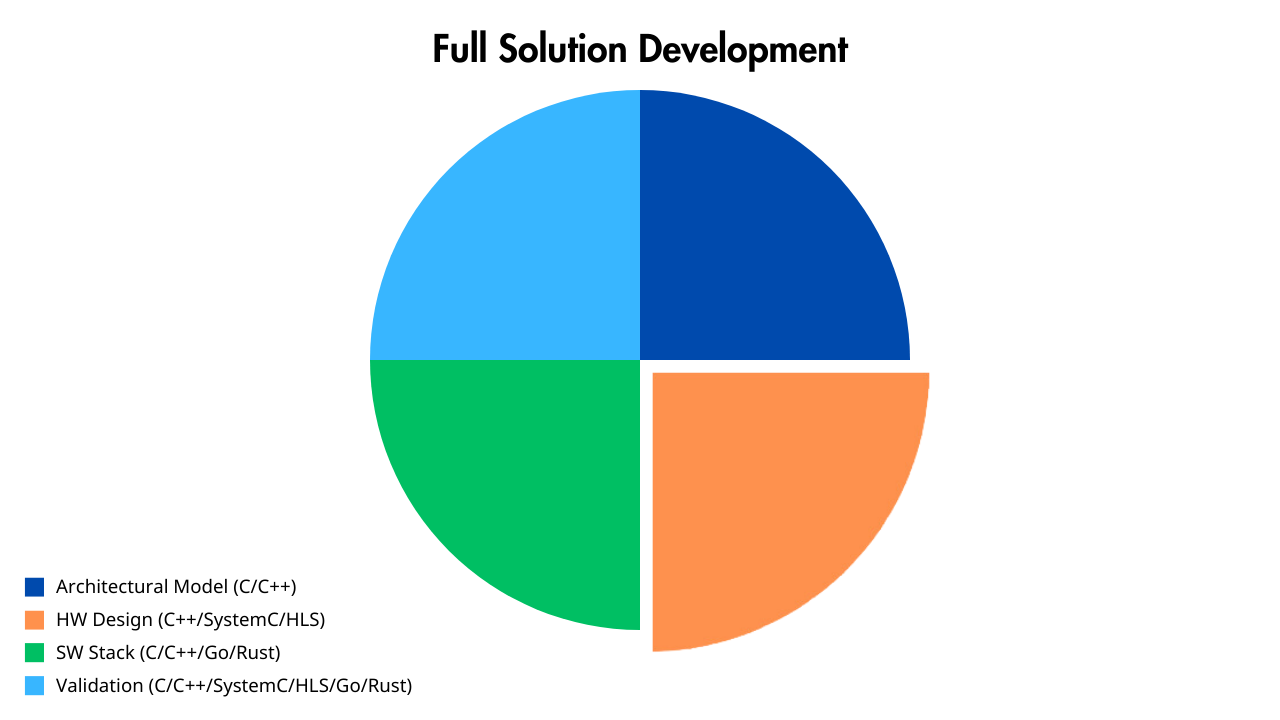
Modern SoC and ASIC development is increasingly taking advantage of the opportunities offered by high-level synthesis to accelerate and improve. This enables the use of standard software industry techniques at all stages of the full solution development:
- Architectural modelling – this is often written in C or C++
- HW Design using HLS – usually written in C or C++ subset
- SW Stack – usually written in C, C++, Go or Rust
- Validation – testing and debugging of the integration of the pieces above
This article dives deeper into the underused, but hugely powerful tool of time travel debugging, how it can be applied to HLS, and explains how it can be used by engineering teams to get faster time to market, higher coverage, improved PPA and increased engineering productivity.
Why High-Level Synthesis?
(Feel free to skip this section if you already know about and are using HLS.)
High-Level Synthesis (HLS) is a hardware design process whereby a high-level specification of a problem can be modelled and developed in a locally executable language (including C, C++, and SystemC), and later compiled into Register-Transfer Level (RTL) logic for synthesis to silicon.
In the RTL world, a solution is typically represented by a high-level model (e.g. coded in C) and a separate RTL implementation in a language such as Verilog or VHDL. Further, the RTL implementation will need fine tuning for various operating and manufacturing configurations (e.g. different clock rates, area constraints, process nodes).
HLS avoids the need for this duplication and triplication of effort. One HLS model is designed and from that various targeted RTL implementations can be configured and compiled. Theoretically, a huge reduction in work!
This provides the following benefits, regularly cited by the industry:
Time To Market
By focusing on only one implementation, a design can be ready to be taken to production much sooner.
Power, Performance and Area (PPA) Exploration
HLS compilers are configured for the target manufacturing node’s characteristics (process, clock rate, area constraints, etc.). Leaving a lot of the manual PPA optimisation work to the compiler saves engineering effort.
Further, by writing the specification in a language better suited to rapid prototyping, engineers can explore architectural changes swiftly. This allows architectural PPA experiments to be tested and validated quickly.
Shift Left
The HLS specification is compiled to run natively on a server during development. This allows for industry standard coding techniques to be used (discussed later) resulting in better quality code.
The same implementation as the end-HW can be tested with firmware and software layers running directly against it. This allows early validation of a proposed hardware design with production drivers and applications, enabling requirements and features to be proven well before any design freeze milestones.
Standard Software Flow
Writing HLS is writing software (of course, with a close eye on the final HW). HLS development can leverage all the benefits of the software industry techniques and tooling, allowing higher quality code to be designed more efficiently.
But… these advantages only hold true if developers are actually more effective than they were designing RTL directly.
Overview of “Software” Industry Standard Techniques
By coding in HLS (e.g. C, C++ and SystemC), an engineer can employ a wide range of standard techniques from the “software industry”. I use quotation marks as, really, these are becoming standard techniques in the HLS hardware world too!
There is widespread availability of verification tools: for example, coverage tools (detailing how well tested code is), memory checkers (looking for memory leaks and invalid accesses) and various sanitizers (to spot otherwise challenging bugs). These considerably improve the quality of the HLS specification and add an extra dimension of validation on top of the final HDL verification stage.
At the development and debug stage, a designer can employ a standard debugger, enabling an engineer to interrupt the flow of the software at certain, specified points and examine the contents of memory and local variables.
Debugging SystemC Models with Time Travel Debugging
Debugging is all about root-cause analysis. When debugging in a traditional system, the developer is forced to add logging output to their code and wade through the log file to see what happened. A forward-only debugger, such as GDB, isn’t much better: you can’t see how your program got into the state it’s in, so can be of limited help in root-cause analysis.
A time travel debugger records the program’s execution as it proceeds. To do this efficiently, it notes the results of non-deterministic events (e.g. user-kernel calls, file I/O, device register accesses). During debugging, the execution can proceed in either a forward or backward (reverse) direction: the debugger will use its recording and knowledge of non-deterministic events to update local variables and stored memory.
This enables engineers to rapidly solve bugs and understand code, for example by asking:
- How did the execution get to this point? Which branches were taken? What decisions were made?
- How did these data get their current value? When were they corrupted? When were they modified?
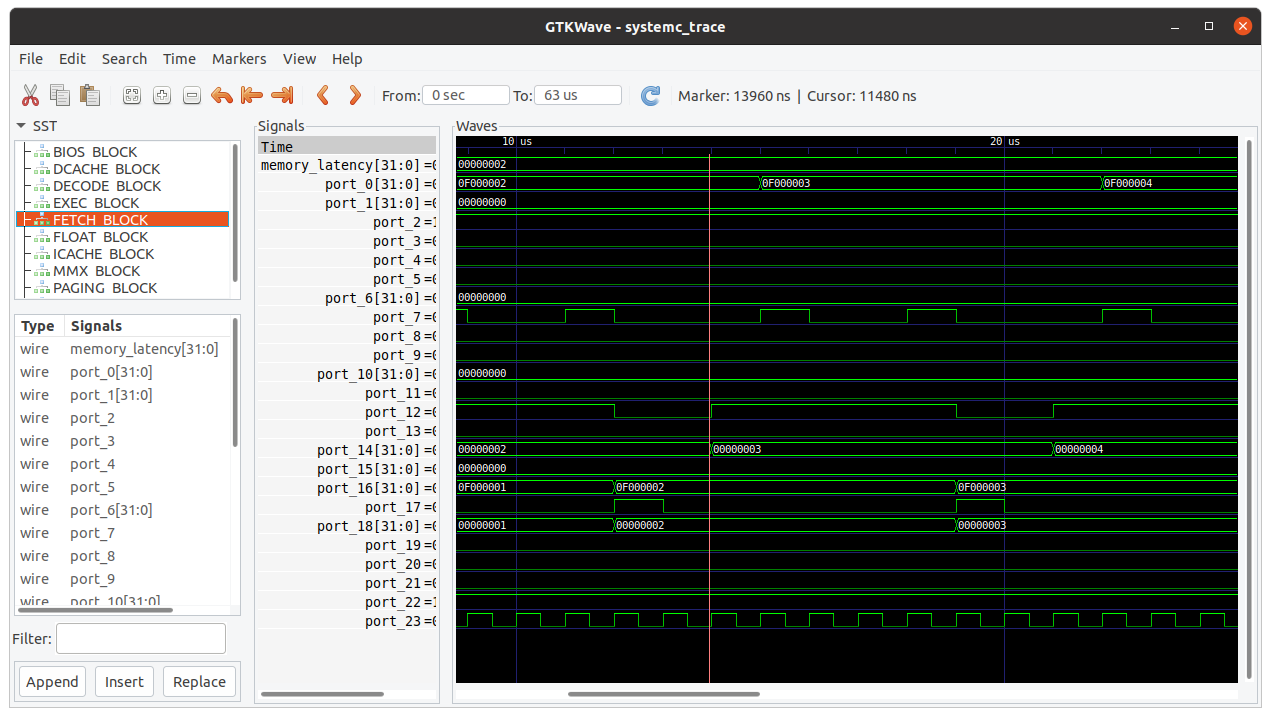
In addition, traditional waveform output of an HLS execution can be extracted from a time travel debugging recording. This allows engineers more familiar with traditional RTL HW design techniques to transition more easily to HLS. It is possible to click through from a waveform view to load the same point in a debugger.
Time travel debugging can be integrated into a regression test flow, so that failed tests are automatically recorded. This allows an engineer to debug a failing test, without the need to sync their codebase to the right revision, rebuild and reproduce the failure themselves.
Time travel debugging and waveform viewing are integrated into the VS Code Integrated Development Environment via plugins, enabling their use in a familiar and stable graphical program. The tools can also be used on the command line.
What Engineers Using Time Travel Debugging Are Saying
The following feedback, from users of time travel debugging, highlights the power and effectiveness of time travel debugging with HLS:
“We estimate our debug time on issues is reduced by about 4x. This productivity improvement gives us more time back to focus on closing coverage more completely, prior to tape-out.”
“By using time travel debugging, we are able to bring up new applications significantly faster. Before, using traditional techniques we might have five out of ten key applications running on a new platform prior to tape-out, but now we are at eight.”
“HW engineers aren’t used to HLS debug and can get easily lost if there aren’t waveforms or some temporal view. Those who are familiar with setting breakpoints in GDB find the ability to step backward and forward in time really improves and accelerates their ability to solve bugs, leaving more time for quality and PPA improvements.”
“Concurrency bugs, such as deadlocks and race conditions, can take ages to find using traditional techniques such as logging and forward-only debugging. These kinds of bugs are pretty common in SystemC designs, where many threads can be accessing the same data and resources. With time travel debugging we can isolate these issues very quickly.”
“I find I can debug issues quickly by finding where data have changed, without needing to worry about how the data are passed through the system. For example, in the case of memory corruption, I often only need to run the last command to see where the data were changed, and I’ve immediately found the location of my bug!”
“We love the recording of our regression failures! It means we can quickly debug a test failure first thing in the morning, without having to spend an hour or more reproducing the problem ready to get started. This gets our regressions passing again sooner, reducing the time the rest of the team are blocked on submissions.”
“As a new team member, recently I needed to come up to speed with a new and large codebase. By loading the execution within a time travel debugger, I could bookmark key points in the code and in time, and step back and forth to understand the flow of the code and its interoperation.”
Conclusion
We have discussed some powerful benefits of HLS, enabling:
- early entry to market
- better PPA exploration
- early testing, employing Shift Left
- increased capability to implement new features
To unleash these benefits, engineers need to be their most effective. By leveraging “software” industry standard techniques, such as time travel debugging, engineers can be their most effective by:
- rapidly understanding and fixing bugs
- working on new and unfamiliar large codebases with ease and comfort
Want to find out more? Book a call with a Solutions Engineer for a demo and Q&A.
Or, take a look at the How to Debug SystemC with Time Travel Debugging tutorial.

