Resources
TUI Dashboard – New in Undo 9.0
For a long time, GDB has shipped with a fantastic graphical user interface called Text User Interface (TUI) mode. The interface is convenient because it is built into the debugger and it works in a terminal, meaning it is always available wherever you end up debugging.
UDB now extends TUI mode with new types of windows and layouts:
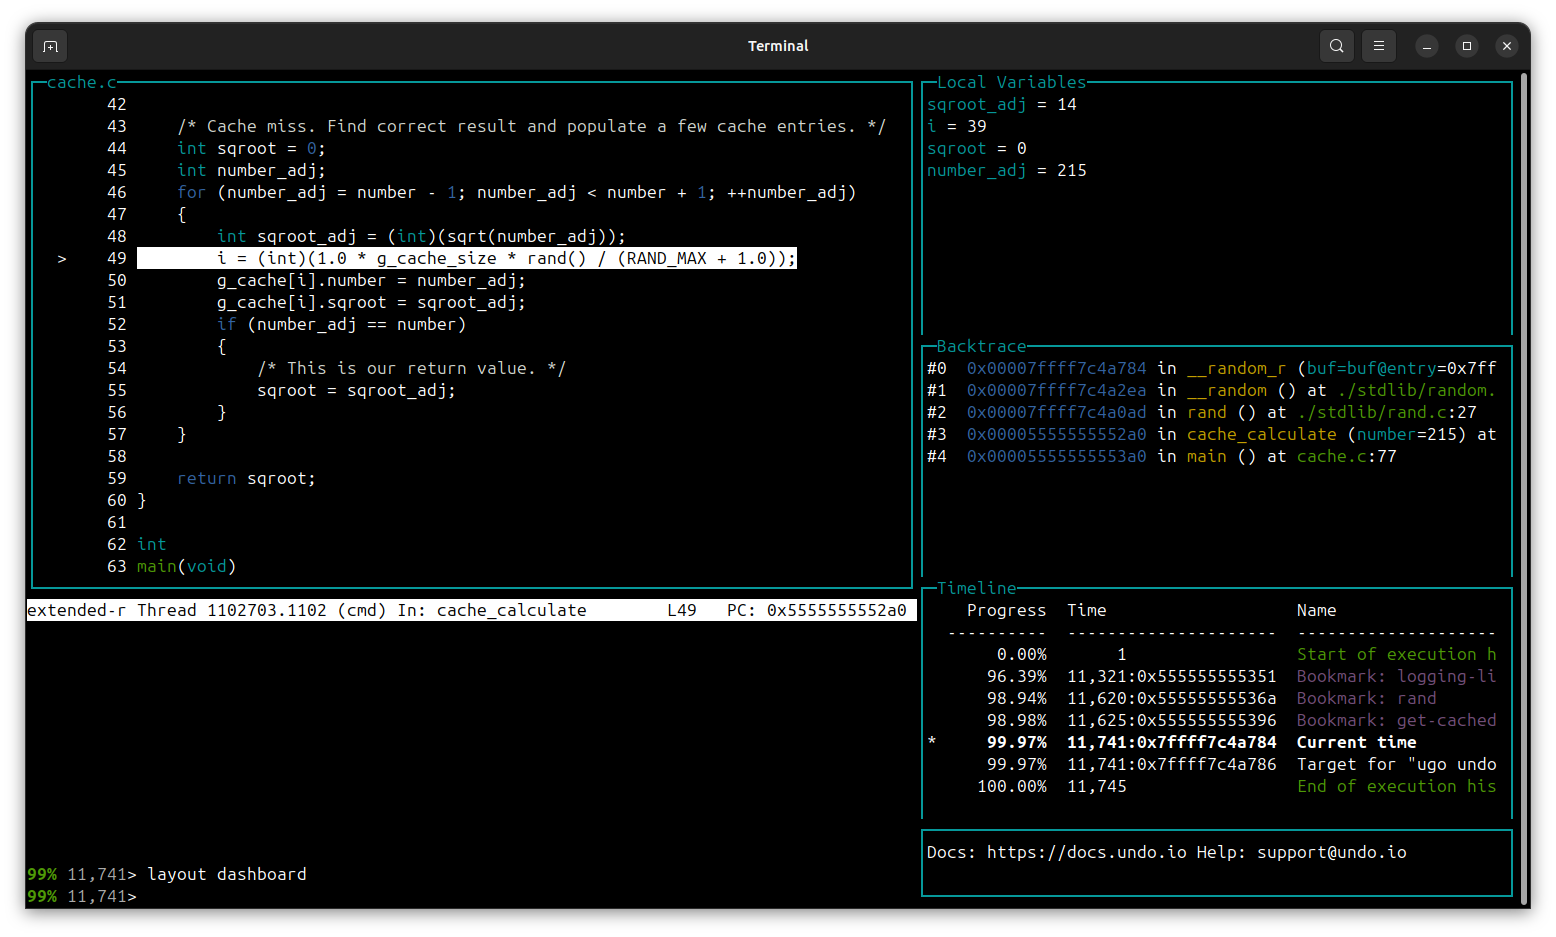
The new layout shows information that is useful when navigating around the source code of an application.
- The “Local Variables” window shows you the value of the local variables in the current function frame.
- The “Backtrace” window shows you where you are in your code base and how you got here.
- The “Timeline” window shows you where you are in the execution history in relation to other interesting points in time, such as bookmarks and the boundaries of your recording.
How can I try TUI dashboard?
These new windows are available are as a beta feature in Undo 9.0. Activate the dashboard layout with the command layout dashboard.
Interested in trying Undo 9.0? Get a free trial below.