Resources
Tutorial: Getting Started with UDB in VS Code
Overview
This quick start tutorial will walk you through how to use the Time Travel Debug extension in VS Code to identify the root cause of a small bug.
You will:
- set up and run UDB (time travel debugger)
- install the Time Travel Debug VS Code extension
- locate and use a provided example program
- learn the basics of time travelling backward and forward through code in order to inspect and easily understand program state
The principles learned by following this guide can be used on on complex codebases with millions of lines of code.
Unpack the Tar file
If you have just downloaded UDB, you will need to install it to get going.
If you have already done this, you can skip this step by clicking ‘Next’ to continue.
It’s easy to install UDB. Here’s what you need to do:
- If you’re debugging remotely via the Remote – Containers, Remote – SSH or Remote – WSL Visual Studio Code extensions, copy the .tar.tgz file that you just downloaded onto the remote system.
- Open the Terminal app.
- Unpack the .tar.tgz file that you just downloaded with the following command:
tar -xzf UDB-Individual-Evaluation-<version>.tgz

- This will create a folder named
UDB-Individual-Evaluation-<version>

Install the VS Code extension
- Run Visual Studio Code
- If you’re debugging remotely via the Remote – Containers, Remote – SSH or Remote – WSL extensions, connect to the remote system.
- Bring up the Extensions view by clicking on the Extensions icon in the Activity Bar on the left hand side of the window, type undo.udb into the search box and press Install.
Open the examples
We will use the sample program cache-cpp.c (cache calculate) that can be found in the examples directory of the UDB-Individual-Evaluation-<version> folder you just created.
This sample program maintains a square root cache data structure in memory and validates it through repeatedly looking up values, caching additional new values on a cache miss.
- Choose File → Open Folder …

- Navigate to the examples folder inside the
UDB-Individual-Evaluation-<version>folder that you created in the last step and press OK.
- You will be building and running the example programs in this folder, so press “Yes, I trust the authors” to allow debugging
- Click on cache-cpp.cpp in the sidebar to open the cache calculate sample program
Build & run the example program
To build and run the examples you’ll need a C++ compiler and the make program.
On Debian/Ubuntu you can install these with sudo apt install build-essential.
- Bring up the Run view by clicking on the Run icon in the Activity Bar on the left hand side of the window
- Press the the green Run button to build and debug
- View the UDB license and press “Accept the license”
- UDB stops the program at
main(). Let’s run it to the end. Press the Continue button to do this


Run UDB & diagnose the problem
- We can see from the Call Stack that the program has crashed out with an
abort():
Note: unless you havelibcsources installed on your machine you’ll see messages from VSCode about not being able to display source code – you can safely dismiss these messages as they occur. - Let’s analyze the program’s execution and diagnose the reason for the failure.
By selecting the Terminal tab we can see the output of the program – the number that the program is pulling out of the cache is not the expected number.
- Because UDB is a time travel debugger we can run the execution of the program in reverse.
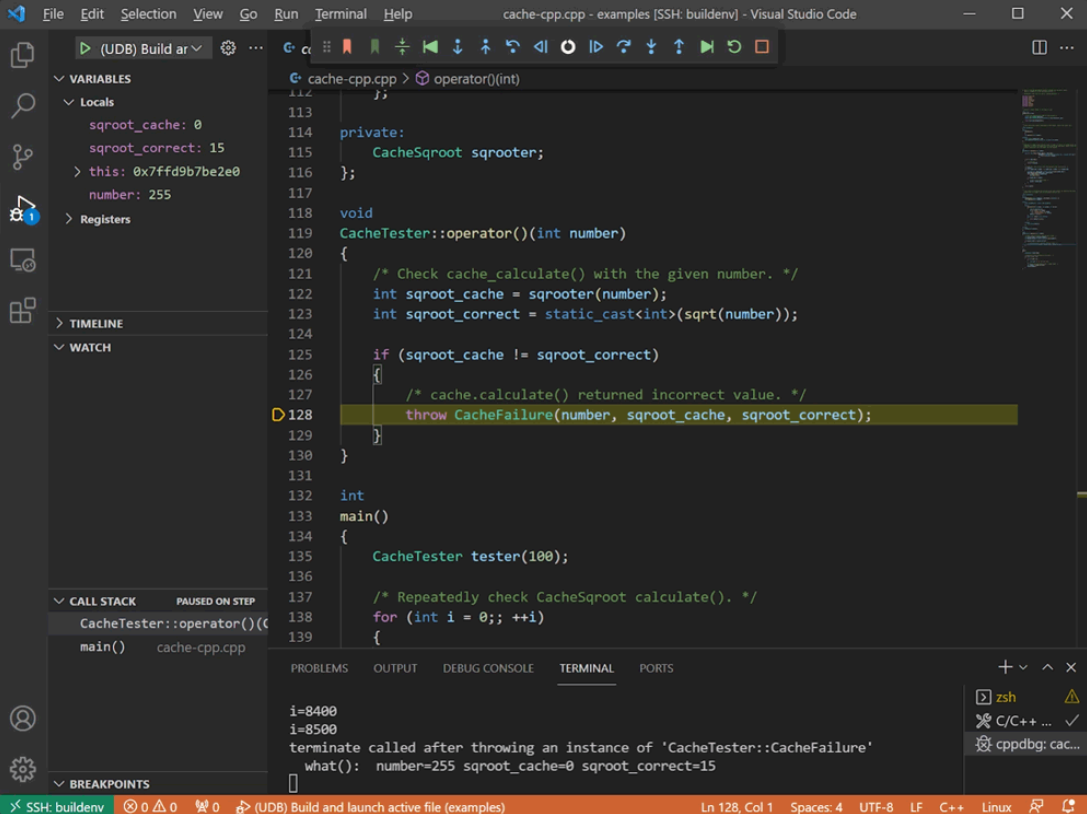
Press the Reverse Step Out button six times to reverse up the stack to thethrow()statement in cache-cpp.cpp.
- With a time travel debugger you can go back to any line of code that executed and see the complete program state.
So we are currently looking at the state of the variables at the point that the exception was thrown.
Looking in the Variables window we can see that the code is querying the cache for the square root of the number255.
The integer square root of the number255is15(insqroot_correct). Butsqroot_cacheis0; which is the wrong value.
- This is the point where the defect manifests, but it’s not the root cause of the defect. We need to find the point where the cache is populated with the incorrect value. Line 123 is where the
sqroot_correctvariable is set.
Use the Reverse Step Over button 3 times to step back in time to line 123.
- The previous line is where the
sqroot_cachevariable is set to its incorrect value. Use the Reverse Step Into button to step back into the function which returns this value.
- Press Reverse Step Over to step a little further back in time to where this function returns the incorrect value
- Switch to the Debug Console, type
f->secondand pressEnter. We can confirm that the number being pulled out of the cache is0; which is incorrect.
- Now we need to find out where this cache entry was populated with this incorrect value.
We can do this by setting a watchpoint (a.k.a. a data breakpoint) on the incorrect entry in the cache and running back in time to where it was set.
In the Debug Console type:`watch -l f->second(note the backtick) and press Enter.
- Press the Reverse Continue button to run backwards in time and stop at the moment this cache entry was written to.
Note: VS Code reports hitting a watchpoint that was set from the Debug Console as an “Unknown watchpoint”. - We’re in the depths of the C++ STL. Press Reverse Step Out four times until we’re back in our code, just before the incorrect value is placed in the cache.
- Looking at
number_adjin the Variables window we can see that the code is trying to calculate the square root of-1.
And looking atsqroot_adjwe can see that it’s storing the square root of-1as0.
So there are two problems – why does the code think the square root of-1is0, and why is it trying to calculate the square root of-1in the first place?
sqroot_adjis calculated on the previous line; line 69. Because UDB is a time travel debugger we can call arbitrary functions at any time in the program’s execution history.
So in the Debug Console typesqroot(-1)and press Enter to see what the function returns.
Thesqroot()function returns a special value that indicates “not a number”, which on line 69 is statically cast to anintto fit into the data container which is expecting integers.
This explains why the code is storing 0 in the cache; there’s no check that the number being stored is representable as anint.- You’ve discovered that the root cause of this program failure happens as a result of attempting to put the square root of
-1into the cache, which was not intended.
But why is it trying to calculate the square root of-1in the first place?
That happens because the for loop in line66loops fromnumber-1tonumber+1, but there is no protection anywhere to deal with the special case that we just hit where the number is zero.
A simpleif (number_adj < 0) continue;at the start of the for loop would have avoided this error.

Tutorial Complete
Congratulations! you have successfully used time travel debugging in VS Code to diagnose the root cause of an error!
You’re now a time travelling Bug Hunter!
Next steps
Do more with time travel debugging in VS Code.
Help and Support
If you get stuck, help is always at hand.