Resources
Learning a New, Complex Codebase Doesn’t Have to Be a Headache
You’ve just started working on a large, complex codebase you’re not familiar with and need to get a picture of how the system works. You want to understand how different pieces interact, without spending multiple weeks reading the code line by line, opening up dozens of files, printing data structures, mentally recreating the flow, or asking more experienced engineers for help.
Sound familiar?
Our newest engineer, Alasdair Mostyn, needed to quickly get up-to speed with Undo’s complex codebase written in C. He explains how he got to understand the code flow during his onboarding in a matter of weeks using UDB, the Time Travel Debugger from Undo.

I was tasked with investigating a known issue in the Undo codebase in an area unfamiliar to me. I first had to learn how the code is supposed to work in order to eventually diagnose and fix the bug. The bug I was investigating was a problem within the search code*, where it hangs if you try to reverse-continue over an instruction that raises a SIGILL.
To investigate the problem, the first step was to make a recording. This can be done by running (or attaching to) a process within UDB and then using the usave command. However, in this instance I made use of the live-record tool’s --record-on program option, as this easily creates a recording for any child process matching a given name.
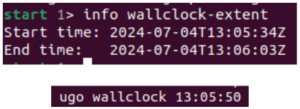
Within this recording, I needed to find out where to look. When recording the problematic process, I had allowed the search to continue for some time despite not making any progress. After loading the recording, I used the info wallclock-extent command, which allowed me to see the time at the beginning and end of execution. With this information, I then used the ugo wallclock command to get to a rough time in execution history where I knew it must have been trying to search. Once there, I stepped out a few stack frames using finish and found myself in the middle of an infinite loop within the s_search_slice() function.
Before moving on, I wanted to make absolutely sure I was at the right point within the recording, and so I used the info locals command to take a look at the local variables. Using this, I discovered a variable signo which held the value 4 – the numeric value of SIGILL. This confirmed that a SIGILL had been encountered, and I had therefore found the correct point in execution history.
Now I knew I was in the right place, I needed to understand what the code was supposed to be doing. To help with this, I created a new recording of a successful search with reverse-continue, this time without the problematic SIGILL-raising instruction.
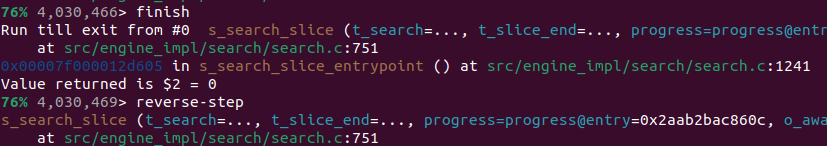
Using this recording of a successful search, I put a breakpoint within the same loop, which I knew must have terminated because the search completed. To find where that happened, I made use of the finish command to get to the end of the function, and then stepped backwards using reverse-next. I discovered that the loop exited because of the condition t_current >= t_slice.end, meaning we have searched the entire current slice.
![]()
This confirmed that in the bad recording, t_current was not being updated when search encountered a SIGILL. This was to be expected, as search cannot progress past an instruction it is unable to execute; but there was no other mechanism to detect this and escape the loop.
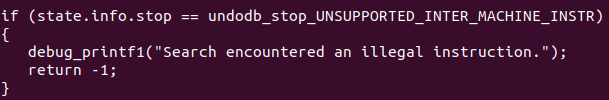
Now back with the bad recording, I made use of GDB’s info variables command. This displays all of the available global and static variables. Among these, I found a state.info.stop variable, with the value undodb_stop_UNSUPPORTED_INTER_MACHINE_INSTR. Given the value, I suspected this was set upon encountering the illegal instruction. With the use of the last command I confirmed this was the case, and it became clear that our loop did not recognise it needed to exit when that value was set.
Finally, I was able to implement the fix, by checking the state.info.stop variable and exiting the loop, therefore cancelling the search.
For me, the main benefit of using Undo was that I could move through the code independently from the actual execution, meaning I did not have to worry about making a mistake in my navigation and therefore having to restart from scratch. This allowed me to concentrate on the code itself, rather than thinking twice about how I was navigating. This really reduced the mental load involved.
I found the last command was effective for determining the meaning of variables in cases where the name was not immediately self-explanatory. This often reduced the time I would have otherwise spent looking through the code for uses of that variable.
The wallclock commands were useful to find a rough time at which to start debugging. This allowed me to head straight into debugging with Undo in a matter of minutes, instead of having to search the unfamiliar codebase for where the issue might be occurring.
Overall, I found Undo to be an extremely useful tool to assist with learning and debugging an entirely new and complex codebase.
Interested in finding out more? Book a demo with one of our solutions engineers to learn how your newest software engineers can use Undo to become productive quickly and independently.
*Search Code:
When the reverse-continue command is used, we must search through the recorded history for the most recent breakpoint, watchpoint or signal, as this determines where execution should be reversed to. This involves splitting the search into “slices”, with each slice being the time between two adjacent “snapshots” (The stored state of a process at a particular time). Each slice is searched forwards, starting with the most recent slice. As soon as one of the necessary conditions are met, search has completed, and we return the process to this point.