Resources
Test smarter, not more: Using scripts to analyse recordings

Diagnosing failures is always annoying. Whether they are caused by legacy issues, new code, external infrastructure problems or simply a poorly written test that occasionally fails, they can be a right pain in the bum. Intermittent issues are particularly hard to diagnose, as these are typically factors outside of your control, and are therefore hard to reproduce.
One of our customers who is using LiveRecorder for Automated Test recently was experiencing just such an issue. Their program under test has to access a network file system for some data – pretty typical behaviour for a test farm. However, they have a longstanding issue with their test infrastructure: connectivity is a bit patchy, and the program under test sometimes fails simply because it cannot access the file system share. Annoying and avoidable, sure, but these infrastructure issues aren’t always an easy fix.
So how do you avoid wasting engineering time with these sporadic, irrelevant failures? How can you tell? Was it that annoying infrastructure bug, or was it the new code that is being tested? You’d typically need to look at the log files produced by the test run. If it’s not clear what’s wrong, you send the lot to the development team for further investigation. In the case of an infrastructure failure, they would come back having put valuable engineering time to waste, probably irritated that you had bothered them again about your known intermittent issue. If you’re lucky, they might add some new logging to better detect the issue in future.
This is all a big waste of time.
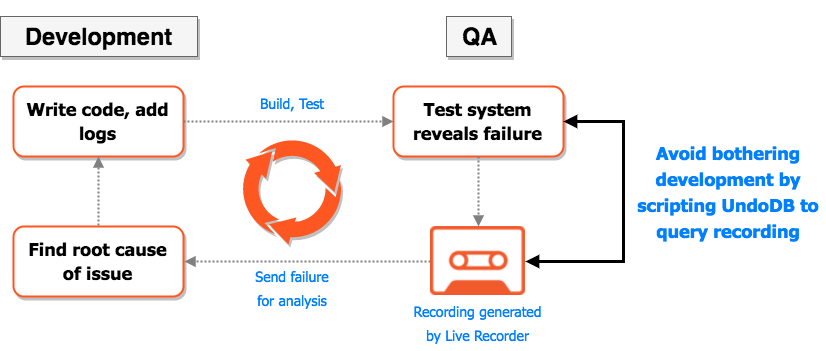
If you are running LiveRecorder for Automated Test, you can generate recordings of your test run which can be loaded into our reversible debugger, UndoDB. Everything that happened to the program down to the machine instruction level, is accessible for analysis *after* the program has run, even on a separate machine. With such a recording, an engineer can rewind to the point of failure quickly and see exactly what was going on at the time, making it much easier to distinguish the cause of the failure. The time to resolution and quality of the Dev/QA communication channel is therefore pretty good already.
This solution still requires some developer time, though; you need to send the error logs/recording (if available) back to Development, who have to then prioritise and deal with it like any other work item before they can implement a fix, or tell you that it wasn’t a real failure.
With an Undo recording and UndoDB, it is really easy to get basic information on known issues without any human intervention. In this case, we wrote a simple GDB script for our customer’s QA dept that replays the recording to the point of failure and examines the last interactions with the filesystem to determine if a network error occurred. If it did, there’s no need to send it back to Development or modify any code! Sure, the developers could just put better logs in to gather this info on crash, but using this method they don’t need to, and QA doesn’t need to rely on everything being perfectly logged. Indeed, is manual logging even necessary any more? Perhaps not…
Tl;dr: With Undo recordings and UndoDB, you can automatically query a recording file for insight into anything that happened during runtime, saving your DevOps and engineering teams time and energy. Bigger logs are so last century!
You can learn more about scripting gdb on the gdb website, or this stackoverflow post, and more on UndoDB in our docs.
