Resources
VS Code Extension Release: Time Travel Debug for C/C++
Our engineering team just released version 2.0.0 of our Visual Studio Code extension: Time Travel Debug for C/C++. If you’re not familiar with it, it supports time travel debugging within your preferred IDE.
Watch the video above to learn what you can do with the extension in VS Code and how to get started. Demo and setup guide presented by Senior Software Engineer Mohini Aggarwal.
Below are the key improvements made this new release.
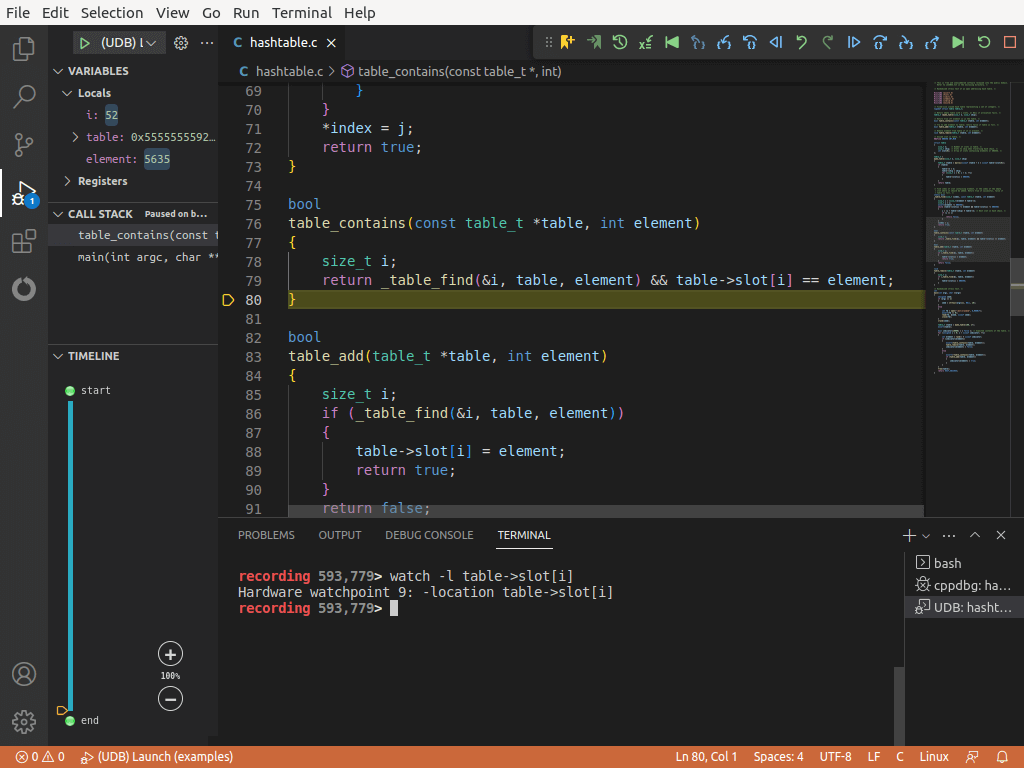
There is a new integrated terminal interface (at the bottom of the Visual Studio code window) which starts automatically when a debug session is initiated. This works in the same way as UDB on the command line, allowing users to seamlessly switch between using the graphical user interface (for instance, clicking the “Step Into” button) and the terminal (for instance, typing the step command).

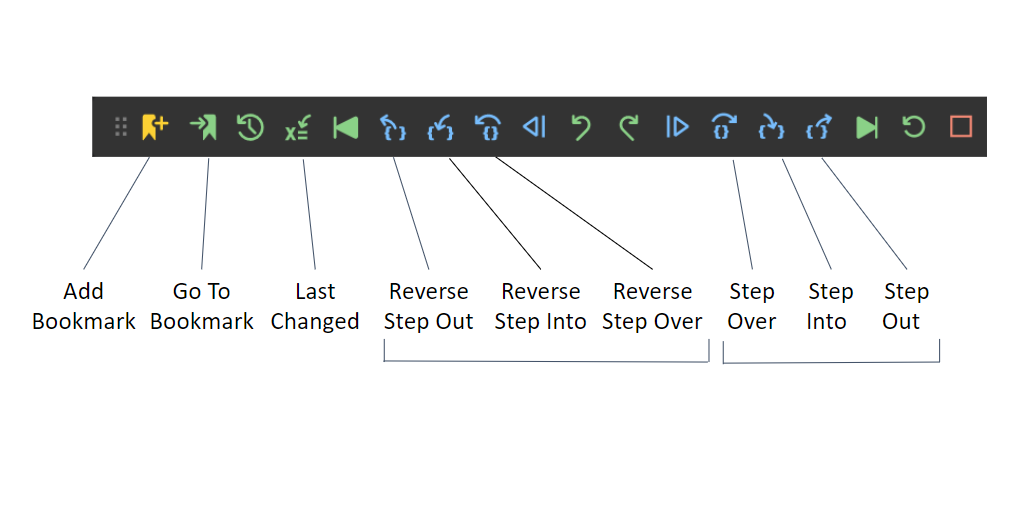
To make time travel debugging simpler, some icons in the debugging toolbar were redesigned to make it clearer what the buttons do.

You don’t have UDB installed? That’s ok: you can now automatically download and install a free trial version of UDB directly from within Visual Studio Code.
Visit the Visual Studio Code marketplace to try time travel debugging in VS Code now!
