WatchPoint

GDB wizardry and 8 essential Linux application debugging tools
Chapter 1: Debugging is the most underestimated part of programming 02:35 This is a talk I gave at the ACCU developer conference earlier this year on GDB wizardry and essential Linux application debugging tools. As usual, I’ve pulled out some particularly interesting and useful points below, but do watch the video above to get the juicy details. Debugging is the most underestimated part of programming. While it’s better not to write the bugs in the first place, there will always be bugs. A quote from Brian Kernighan sums up the situation: “Everyone knows that debugging is twice as hard as writing a program in the first place. So if you’re as clever as you can be when you write it, how will you ever debug it?” This has profound implications – it means the debuggability of your code is the limiting factor. Whatever your metric for good is for your code, debuggability is still the limiting factor. If you can make your code twice as good for debugging, you can make your code twice as good. “The most effective debugging tools tool is still careful thought, coupled with judiciously placed print statements.” I’d like to think that in the intervening years, we’ve moved on from the print statement … I classify debugging tools in two classes: checkers and debuggers. Checkers look for instances of commonly made mistakes such as buffer overrun and memory leaks. There are more and more of these. Some are free, some are paid-for and they tend to be very good at saying “there’s the problem”. But… they’re looking for instances of well-known, commonly-done bad things, whereas debuggers are more general code exploration tools. They are trying to get a sense of: what on earth is my program doing? That’s what debugging is. We write these programs with a certain expectation of what they’re going to do, reality diverges from that expectation and we need to find about: where exactly did reality diverge? I want to talk about GDB. It’s been around for a long time, but it’s come a long way and had quite a lot of active development. I want to show some of the things that it can do that you may not be aware of. I have pulled out some nice tips here but there’s much more in the video above. UDB Time Travel Debugger GDB has had python embedded in it for a while and as time has passed, the bindings have become richer. In the video I show how you can run GDB commands from python: I can also pull out information from the GDB debugging environment, allowing me to use python to script powerful debugging tools. A great starting point is the documentation of the module itself with: In the video, I also cover the pretty printers which you can build yourself in python, and those which are in-built for STL. The I’m keen on keeping the The first line preserves your command history across sessions, allowing you to use the up arrow to get to commands from previous debugging sessions. The original implementation of watchpoints in GDB precedes the CPU support for this, so that if you set a software watchpoint and run the program, then GDB will The hardware watchpoint is using the CPU machinery. The x86 will support up to 4 and it will run it at full speed and when the location in memory gets modified, the processor gets a trap and GDB will be notified. It’s reasonably smart, so if you watch a pointer which points to a thing, it will watch the pointer and that offset in the structure that it points to. You can also read more about watchpoints in my other WatchPoint post. The …will print the stack pointer across threads 1-4. This can be used with the backtrace command: The last one is for when you really don’t know what’s going on. It prints the backtrace for all threads with all the local variables for every stack frame. This can be useful if, for example someone is reporting a bug you can’t reproduce and you need a good starting point. Maybe This is not a great reason for it being useful. A better reason is that The problem with In an example I show in the video, I know that a function This is actually a breakpoint which is set on the location … which would only print out the line defined in In the video I go into more detail on how In my experience Valgrind just works. It can be slow depending on what your program is doing – the slow-down can be 10x, 100x maybe – but it’s very easy to use and does just work. It’s very useful for finding uninitialized variables, buffer overruns if they are allocated on the heap and simple memory leaks. Many years ago, I worked in a company where we were making a kernel bypass library for high-performance networking and the customer gave us a bug reporting saying: “Your stuff is broken because my code works fine without your kernel bypass library and I use your kernel bypass library and it stops working”. We scratched our heads and investigated, but we couldn’t get to the bottom of it. So in the end somebody very smart suggested that we run their program without our library but through Valgrind. And sure enough, there was uninitialized data on the stack which they were getting away with without our library because when our library was there it moved things around. We didn’t have access to the source code. This was a binary from the customer. Valgrind was still a useful way to debug that things with almost nothing to go on. If I take a program, compile it and run it through Valgrind: … Valgrind tells me about all these uninitialized memory accesses, tells me where they are uninitialized from and even gives me backtrace: Valgrind has its own implementation of the GDB server inside it which you can then attach GDB to. So if I run: … Valgrind then runs and tells me that to attach GDB I have to start gdb and do this: That gets me into the Valgrind GDB so I can get my backtrace and poke around and see what’s happened: Sanitizers – address sanitizers being the most well-used I think – originally came along in clang and now exist in gcc as well. It seems to be the opposite of Valgrind – all the stuff that Valgrind is good at, sanitizers aren’t and vice versa. Sanitizers are very fast and have good compatibility with other things; so you can use this with reversible-debugging, for example. You do need to recompile because this is a thing that the compiler does, and you’ll notice that the address sanitizer does use quite a lot of memory. While using an address sanitizer is fast, it does have a measurable effect on performance; so one thing you can do is set functions to have the attribute “no sanitize address” if you’ve got some function called in a tight loop that you’re pretty confident is correct. I’ve got this program, which is clearly not a very good program, … which I compile with: If I run this, it spots the problem and tells me where it’s happened: As it’s a bit too generous to show all this other stuff and not our own Undo LiveRecorder. Let’s show this on a bigger process. I’m going to fire up LibreOffice and find its process ID with: … which is the thing I’ve just started. I can attach to this with: And I can see that when I type, it’s a little bit slower but basically works. I can create a file, save it and close LibreOffice. Undo will have written the event log which I can load up into Undo’s reverse-debugging engine (UDB) and do the same kind of debugging as I’ve shown with GDB. Try UDB for freeVideo
Chapter 2: Types of debugging tools 06:44
Chapter 3: GDB 08:31
Chapter 4: .gdbinit 22:25
Chapter 5: Breakpoints and watchpoints 28:40
Chapter 6: Thread apply 34:56
Chapter 7: Dynamic printf 36:10
Chapter 8: Valgrind 49:13
Chapter 9: Sanitizers 55:30
Chapter 10: ftrace 59:32
Chapter 11: strace 1:04:53
Chapter 12: perf trace 1:06:30
Chapter 13: Reversible debugging 1:10:44
Chapter 14: Undo LiveRecorder 1:22:05Debugging is the most underestimated part of programming
– Brian Kernighan, 1979Types of debugging tools

GDB (aka the GNU debugger)
Find and fix bugs in minutes – step back in time to view registers and memory
Learn more »GDB has python
import gdb
gdb.execute('next')
python help(gdb)
The .gdbinit file
.gdbinit file stores your configuration but can be the source of some funky, weird stuff. I’ve seen people put all kinds of things in there that have weird side effects and which make debugging harder and more confusing..gdbinit simple with just:set history save on
set print pretty on
set pagination off
set confirm off
Breakpoints and watchpoints
stepi, as in: single step every single instructions and see if the thing you’ve watched has changed. That’s almost certainly not what you want because it’s super slow.The thread apply command
thread apply command allows you to run a GDB command across one or more of your threads. For example:thread apply 1-4 print $sp
thread apply all backtrace
thread apply all backtrace full
Dynamic printf
printf is the lamest way to debug but actually it is useful. Perhaps this is partly cultural because every programmer started doing debugging like this.printf is really good to get a high level view of what’s going on.printf is that to get more information you have to recompile your program. The dynamic printf command, dprintf let’s you do this – change what printf is doing – from within GDB.mutex_lock_fn is given a mutex structure which I can get a high-level view of with:dprintf mutex_lock_fn,"mutex is %p magic is %u\n",m,m->magic
mutex_lock_fn. This means I can add conditions to it like:cond 2 m->magic != 2880293630
dprintf above when the magic number is not 2880293630.dprintf can be configured for different debugging scenarios.Valgrind
gcc -g uninit.c
valgrind ./a.out
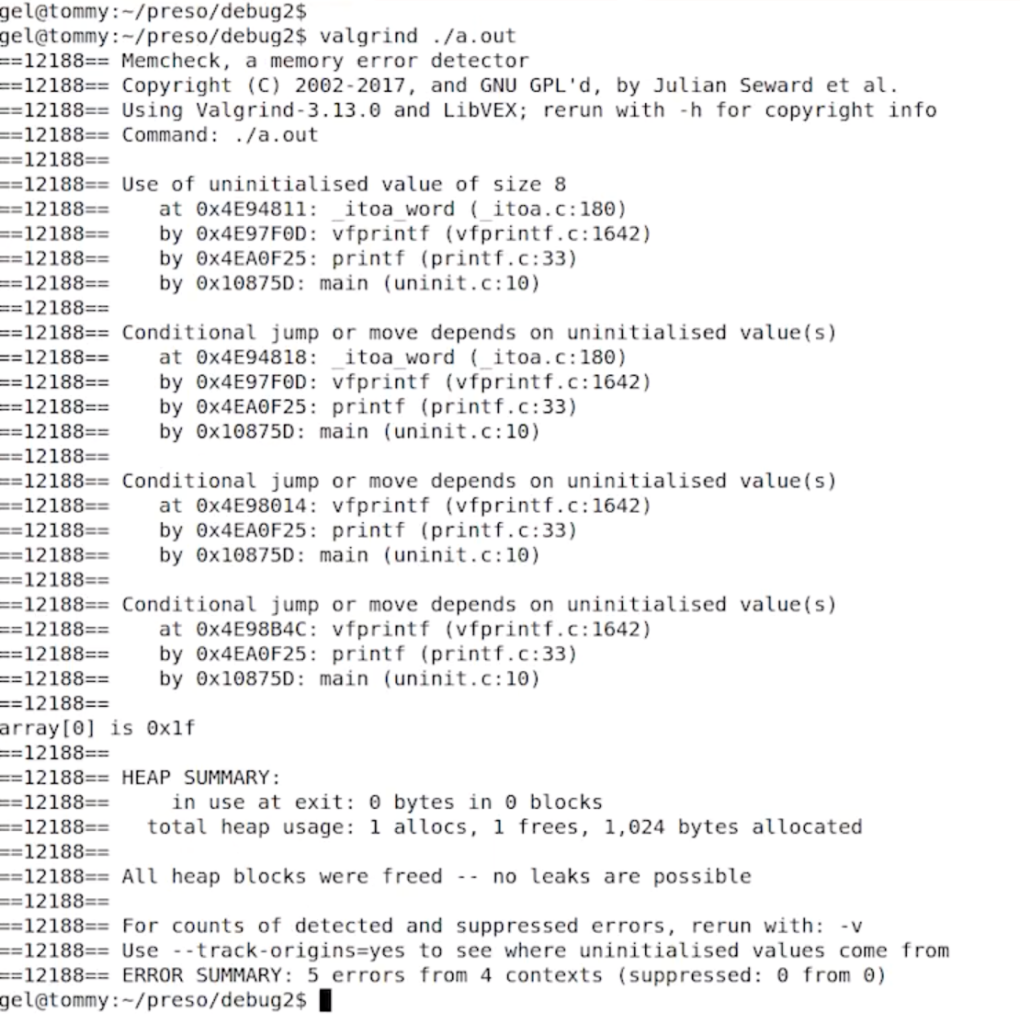
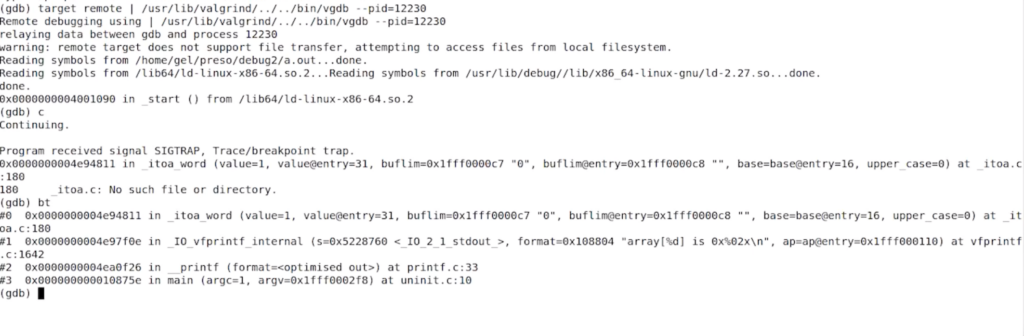
valgrind --vgdb=full --vgdb-error=0 ./a.out
target remote | /usr/lib/valgrind/../../bin/vgdb --pid=12230
Sanitizers
__attribute__((no_sanitize_address))
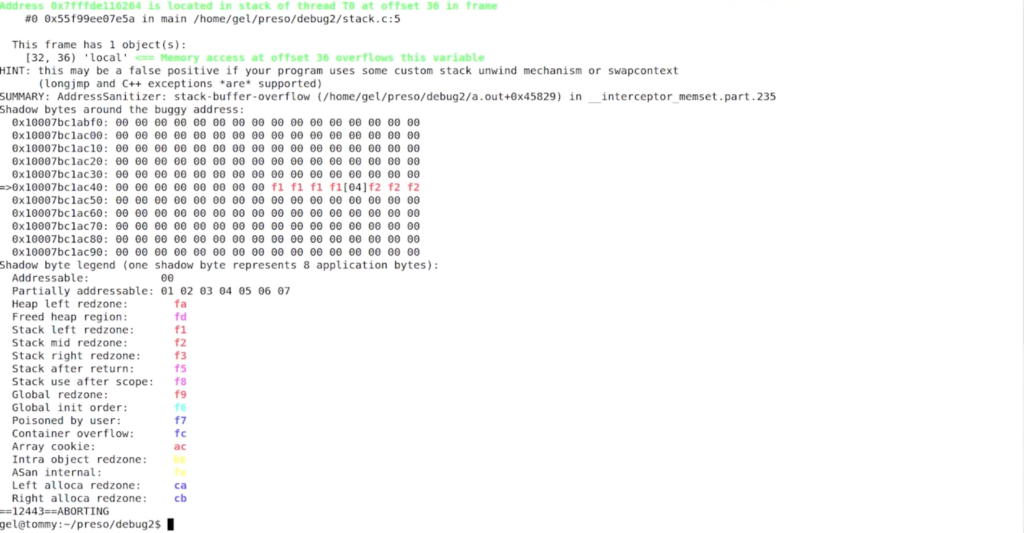
stack.c:#include <string.h>
int
main(void)
{
unsigned char local[4];
memset (&local[0], 0, 1000:
return 0;
}
gcc -g -fsanitize=address --static-libasan stack.c
Undo (LiveRecorder)
$ pgrep -lf soffice
15974 soffice.bin
live-record -p 15974
Find and fix test failures in minutes – including C/C++ concurrency issues
Learn more »
Want debugging tips directly in your inbox?
Share this tutorial