Resources
Debugging concurrency bugs in multithreaded applications
In the bustling city of Seattle, lives a team of brilliant software engineers. They are working on a large complex multithreaded codebase with an intricate system of threads to handle various data streams simultaneously. They love their job…really they do.
Except on the days the application behavior becomes erratic and they discover they have another concurrency bug that’s about to spoil their week. Their hearts sink; they know that pinpointing the root cause of the instability is going to take a lot of time and mental effort. Sounds familiar?
What are concurrency bugs?
Concurrency bugs are non-deterministic defects that arise when the execution of a thread or process disrupts the behavior of other threads (or processes) running at the same time.
If careful attention is not paid to thread locking and memory accesses, there’s a risk of introducing concurrency issues, such as read-after-write hazard, starvation, race conditions, deadlocks etc resulting in unpredictable application behavior like miscalculations, crashes, or hangs.
They are difficult to catch because triggering concurrency bugs is non-deterministic as they depend on a certain set of instructions being executed in multiple threads, with a specific relative ordering and timing, which may not be very likely to occur every time the application executes. During routine testing the program may not exhibit the bug but then, under a slightly different execution timing or system load, the bug may appear.
Concurrency bugs are Wandering Phantoms: like ghosts, the bugs appear and disappear without trace. They are hard-to-reproduce, so they often go unfound and uncorrected. They slip through the net of testing and make it into production. Ouch!
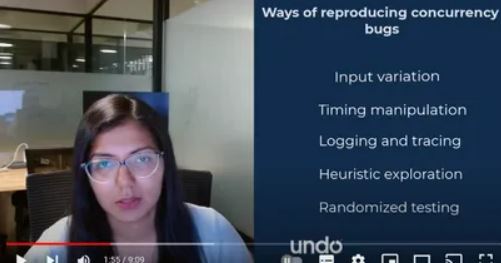
Traditional debugging strategies for concurrency defects
Input variation
By manipulating input data and execution environments, such as varying system load or resource availability, software engineers can force the software to traverse different execution paths, exposing concurrency bugs that would otherwise remain undetected.
Timing manipulation
Altering the timing and scheduling of threads or processes by introducing delays, sleep operations, or other ways to change the interleavings of operations is another technique used to debug concurrency issues.
Logging and tracing
It’s common to see engineers enable detailed logging and tracing mechanisms to capture the sequence of operations and the state of shared data, hoping to catch the mischievous bug in action. Additionally logging can often disrupt the timing of the execution, and potentially help hide the very issue you are trying to reproduce. If you are lucky enough to capture logs of the issue occurring, logs may only show the symptoms, leaving teams with no further clue about the underlying cause.
Heuristic exploration
Sometimes, engineers apply knowledge and intuition about the codebase and the nature of concurrency bugs to guide their exploration.
Randomized testing
Finally, randomized testing can also be used to explore different combinations of inputs and execution paths.
But there’s no getting away from it: reproducing concurrency bugs is time-consuming, iterative, and painful.
An easier way to debug concurrency issues
A senior C++ developer consultant once told a colleague of mine:
“The future ought to be a tool that allows me to understand what happens in multithreaded applications. Logging is limited in its capability to thread-related issues. It is one of the main reasons why people call me a senior C++ developer. They ask me to solve some multithreaded problem in their very big project where none of their developers are able to fix the problem. That is hard because no tool is well adapted to this kind of problem.”
But as fiction writer William Gibson supposedly said:
“The future is already here. It’s just not very evenly distributed.”
In the video above, I illustrate how time travel debugging is the perfect solution for debugging multithreaded applications. As a matter of fact, it’s already widely used by software engineering teams in leading database, networking, and EDA tool vendors; and it’s now rapidly adopted by software teams building financial services software and algo-trading applications.
I demonstrate how the technology works using a sample program (a simple producer-consumer scenario using pthreads in C). It has multiple threads simultaneously accessing and modifying the shared variable val using a CAS (Compare And Swap) operation protected by a mutex lock to ensure that only one thread modifies val at a time. The producer thread increases val by 1 and the consumer decreases it by 1. Finally, the main thread waits for all threads to complete and prints the final value of val. The expected value is 0 because we have an equal number of producers and consumers.
But guess what? Upon running the program, the outputted value is non-zero. So watch the debug session in my video to see how I obtain a recording of the program execution and then analyse the recording to perform root cause analysis – in one swift swoop. (using LiveRecorder)
In the video, I also demonstrate how to use thread fuzzing which interferes with the regular scheduling of threads, in order to expose concurrency bugs more easily.
Final words
Next time you’re faced with a concurrency issue, you can’t say we didn’t show you an easier way out. 🙂
Time travel debugging makes concurrency bugs easily reproducible and allows you to debug them in just one iteration. Less time, less effort, less stress.
By removing the guesswork in root cause analysis, time travel debugging makes debugging predictable. You know that once you have a recording, you can see exactly what the software did and why, and so you can diagnose the root cause in hours, not weeks.
Want a quick call with a Solutions Engineer to explore if LiveRecorder could work in your environment?

By Mohini Aggarwal, Senior Software Engineer at Undo