WatchPoint

How to search memory for a byte sequence with GDB command find?
In this GDB tutorial, we look at the GDB command Sometimes, when you are debugging, you need to find a particular sequence of bytes in the memory space of the program. Perhaps, you want to see all the pointers to a specific object. So, every eight bytes in memory that corresponds to the byte sequence, is an address you want to identify. Note that, the That’s fine – I guess. The Let’s dive in. First, let’s write a simple program that we can use for this GDB tutorial. Open your favorite editor (e.g., emacs, or vi) and type the following lines. Save the program as hello.c Load it. Start it. Done it. Now let’s look at the GDB command find. The syntax for the GDB command Or, You can search the memory space of a program for a particular sequence of bytes specified by The search begins at a Later in this GDB tutorial, I show how you get the memory mapping for your program and use it to determine the start and end addresses for your search query. All search values are interpreted in the programming language of the program. For example, the source language of hello.c is C/C++; so when we later in this GDB tutorial search for the string “Hello, world!”, it includes the trailing ‘\0’. If we don’t specify the You can use strings as search values. Make sure to quote them with double-quotes (“). The string value is copied into the search pattern byte by byte, regardless of the byte order of the target and the size specification. The address of each match found is returned as well as a count of the number of matches. If you want to search in the address space of your program, you need to get the memory mapping for your process and determine the start address, and depending on which How do we give GDB an address range to search? We can use the This GDB command gives you all the memory mappings of the process; all the virtual address ranges, in our case the program hello.c, can access. Taking an educated guess, the “Hello, world!” string I am searching for must live somewhere in the address range from Now, type this. The result in this example is two possible instances of the string in memory. To check, type this: Here you go, we found our string “Hello, world!”. Besides making sure that you search in a mapped memory range, there are other things to remember. If you do search for a string, then you must map the exact pattern. In my video, for example, I forget to type the explanation-mark in my search, which you will see returns no match because it hits the trailing ‘\0’ terminator. The You can search for other patterns than strings, for example, a sequence of characters. Note the single-quotes (‘). That’s it! The Don’t forget to share your takeaways from this GDB tutorial with your project members so everyone benefits!find.find command returns the addresses of all matches; so we must accept possible false positives.find command offers you a different kind of inspection into your program.Hello, world!
#include <stdio.h>

int
main(void)
{
  printf(“Hello, world!\n”);
  printf(“That is all, goodbye.\n”);
  Return 0;
}
$ gcc -g3 hello.c
$ gdb a.out
(gdb) start

The GDB find command
find is as follows:find [/SIZE-CHAR] [/MAX-COUNT] START-ADDRESS, END-ADDRESS, EXPR1 [, EXPR2, ...]find [/SIZE-CHAR] [/MAX-COUNT] START-ADDRESS, +LENGTH, EXPR1 [, EXPR2, ...]EXPR1, EXPR2, etc.START-ADDRESS and continues for either +LENGTH bytes or until the END-ADDRESS.[ /SIZE-CHAR] and [/MAX-COUNT] are optional.[/SIZE-CHAR] sets the size for each search value.b bytesh halfwords (two bytes)w words (four bytes)g giant words (eight bytes)[/SIZE-CHAR], then the size is taken from the value-type in the source language. This is useful when you want to specify the search pattern as a mixture of value types.[/MAX-COUNT] sets the maximum number of matches to return. The default is to print all finds.Show Memory Maps
find command syntax you use, the end address.info proc command to get helpful information about the process. If you expand the command as follows:(gdb) info proc mappings
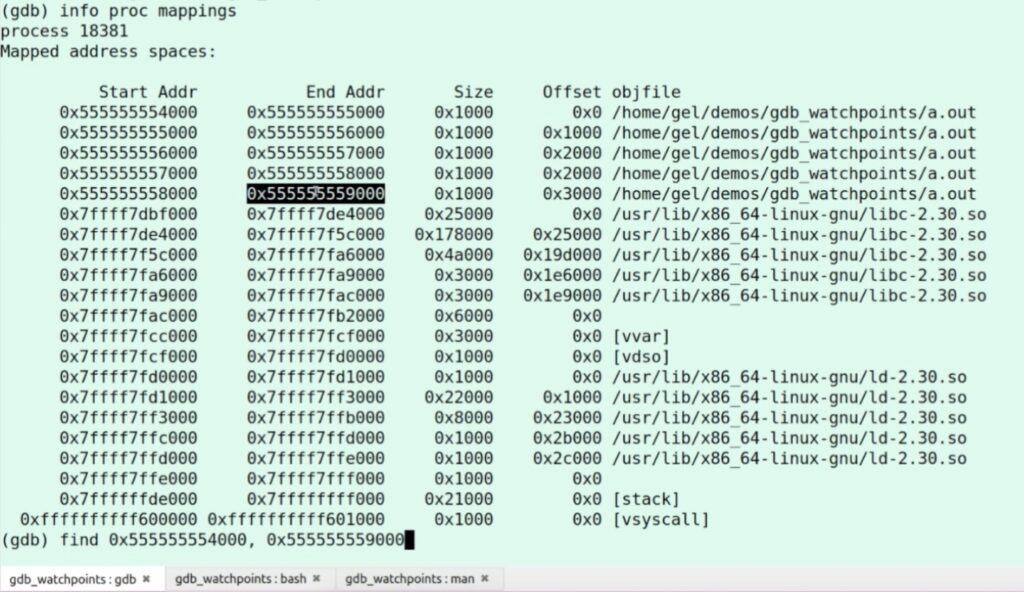
0x555555554000 to 0x555555559000. But, and this is really important, the address 0x555555559000 is NOT the actual end address. It is the address of the first byte that is not mapped! Using this address in our search will result in an error because it searches outside of the mapped address range. I show you that in my video. So, do step one byte back; 0x555555558fff.(gdb) find 0x555555554000 to 0x555555558fff, “Hello, world!”
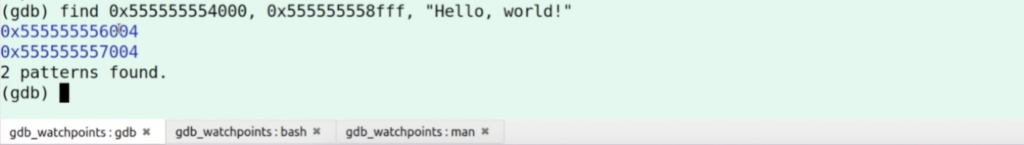
(gdb) print (char*) 0x555555556004


Some final tips
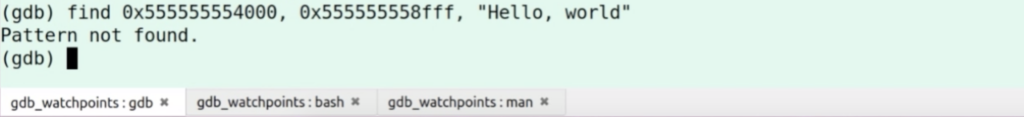
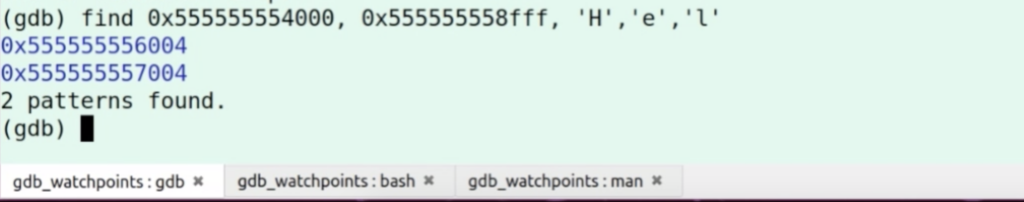
find command searches for the full pattern up to the ‘\0’.(gdb) find 0x555555554000 to 0x555555558fff, ‘H’, ‘e’, ‘l’, ‘l’, ‘o’
find help command offers some extra search options and parameters. Take some time to try these out too. I am sure that you do agree that the GDB command find gives you a useful way to get a different kind of inspection for debugging your program.
Want debugging tips directly in your inbox?
Share this tutorial