WatchPoint

Watchpoints – more than watch and continue
Introduction
Hello! Welcome to gdbWatchPoint where we’re looking at GDB tips and tricks to make your debugging life easier.
This episode of gdbWatchPoint is, somewhat confusingly on watchpoints, which I’m sure most of you will have used, if perhaps in their simplest form. But there’s more to watchpoints than simply watch and continue.
A simple program
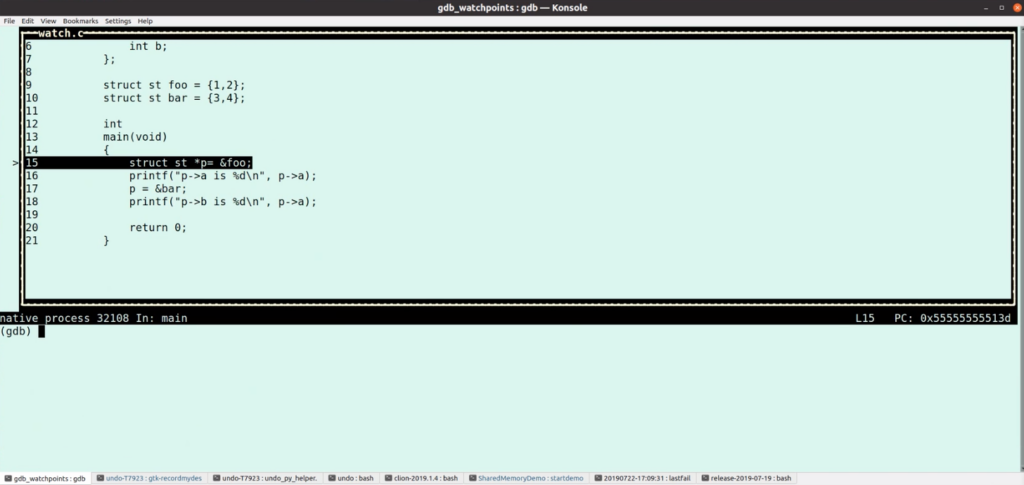
Let’s start at the begining to make sure everyone is up to speed. Here’s a very simple little program:
include <stdio.h>
struct st
{
  int a;
  int b;
};
struct st foo = {1,2};
struct st bar = {3,4};

int
main(void)
{
  struct st *p= &foo;
  printf("p->a is %d\n", p->a);
  p = &bar;
  printf("p->b is %d\n", p->a);
  return 0;
}
This has a structure, a couple of instances of the structure and maintains a pointer to that structure. We can then compile in the normal way and load into GDB:
gcc -g watch.c
gdb a.out
Debugging in GDB
In GDB, start debugging with:
(gdb) start
Now let’s watch the pointer, p:
(gdb) watch p
Hardware watchpoint 2: p
We’ll immediately continue and, because we’re watching for changes in p we hit the first line which modifes p:
(gdb) c
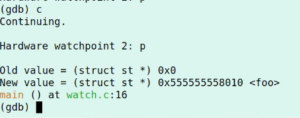
…where we can see that it was set to 0 (zero) but it’s new a pointer to foo. If you continue again, we’re stopped when p changes (because we’re watching it) and p is now a pointer to bar.

Watching pointers
I’m now going to restart the program by running start in gdb, and then list all watchpoints by running info break. (Do this for yourself of follow along in the video.)
I want to watch not just p but also p->a. I can’t do this when I’ve initially started the program in GDB because p is null, which GDB can’t reference. But if I do n (for next) then I can watch p->a:
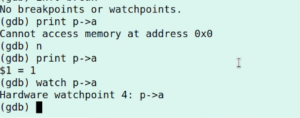
If I then continue with c then the watchpoint does trigger because even though a within foo hasn’t changed, p is now pointing to bar and so p->a has changed from 1 to 3:
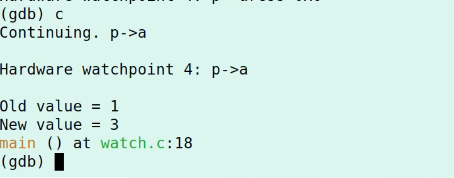
Interestingly, the watchpoint won’t change when the memory is written, it will change when the memory is changed.
Software watchpoints
You’ll have noticed the “Hardware watchpoint” in the output from GDB. Watchpoints preceed hardware support and GDB has a notion of software watchpoints as well.
If we start the program again with start. If I then do:
(gdb) watch foo
Hardware watchpoint 6: foo
… you can see that GDB watches that with a hardware watchpoint, but if this structure was a big array or it was misaligned then GDB would use a software watchpoint.
An easy way to always get a software whatpoint is to watch a register because you can’t use hardware watchpoints with registers on x86.
watch $sp
If you do this, you will notice the difference – this is “watchpoint” not “hardware watchpoint”:
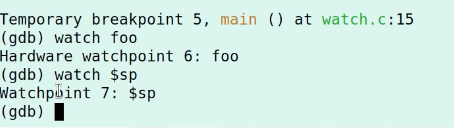
Watchpoint (that is, software watchpoint) is the default; but hardware watchpoint is almost always what you want.
If I now continue the program, GDB is going to single step one instruction at a time, then GDB is going to observe this and ask “has the watch data changed?”. In some situations that might be what you want, but if you’re watching data and you go into this single step mode, it probably isn’t because it’s super slow – 10,000s times slower…
Location based watchpoints
Let’s look now at location based watchpoints. Often with C and C++ programs, I’m looking for memory corruption errors, so some kind of pointer error. What variables are in scope and what they’re set to at the time aren’t really what I care about. What I care about is a location in memory and who’s overwriting it.
Again, let’s start gdb. You might also need to delete your watchpoints with delete.
Start, do next and watch:
(gdb) start
(gdb) n
(gdb) watch -l p->a
If I then continue, the watchpoint isn’t hit because that doesn’t get changed. Let’s modify the program to show what happens if it does get changed. Update the code so that after the p = &bar; line your code reads as follows:
p = &bar;
for.a++;
Recompile this, launch GDB again, and let’s debug again:
(gdb) start
(gdb) n
(gdb) watch -l foo->a
(gdb) c
When I continue (the last line), GDB stops on line 19:
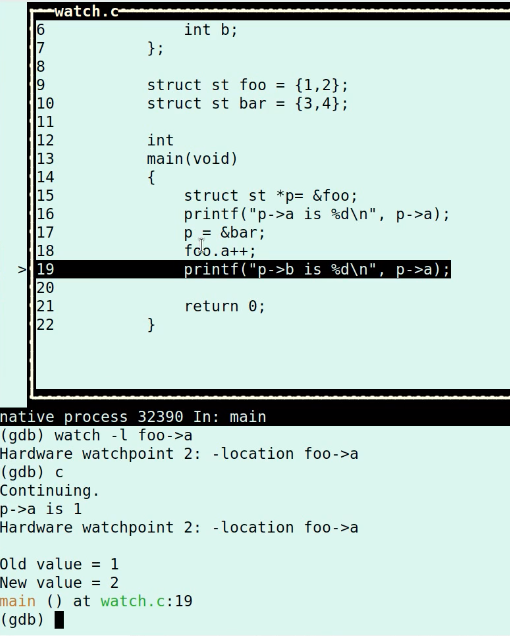
Event though p->a has not been aftected by that line, we were watching the location and so GDB did stop. (In the video I show how you can do this with older versions of GDB which don’t support this way of doing location based watchpoints.)
How all this works
To see how this works, you can look at the assembly using:
(gdb) disas
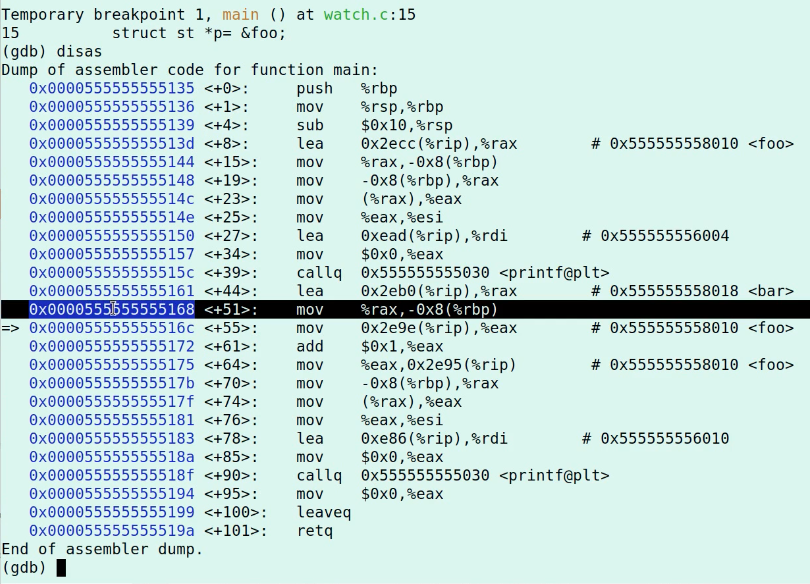
The hardware will stop the program after the instruction that writes to the memory has completed. The highlighted line above is the write which increments foo.a and the line after is where we stop.
Read watchpoints
Another feature of watchpoints is read watchpoints which are triggered when the location is read (rather than written). To set this for p I would do:
(gdb) rwatch p
(Not all hardware supports this. x86 does.)
That’s it for watchpoints. Hope you have good fun with them!
GDB Training
Master GDB and save time debugging
Learn more »
Get tutorials straight to your inbox
Become a GDB Power User. Get Greg’s debugging tips directly in your inbox every 2 weeks.
Want GDB pro tips directly in your inbox?
Share this tutorial