Resources
How to Optimize Your Debugging Workflow and Improve Developer Productivity with LiveRecorder
A few months ago, I published a demo video showing how to rapidly diagnose a SQLite bug using time travel debugging. For that process, I used Undo’s LiveRecorder (Observatory) platform, but didn’t go into detail about what it is, and some of the hugely useful features it can offer individual developers and their teams, so let’s revisit that today.
As a quick recap: about 30 seconds into the video, you see an issue in our ticket system.
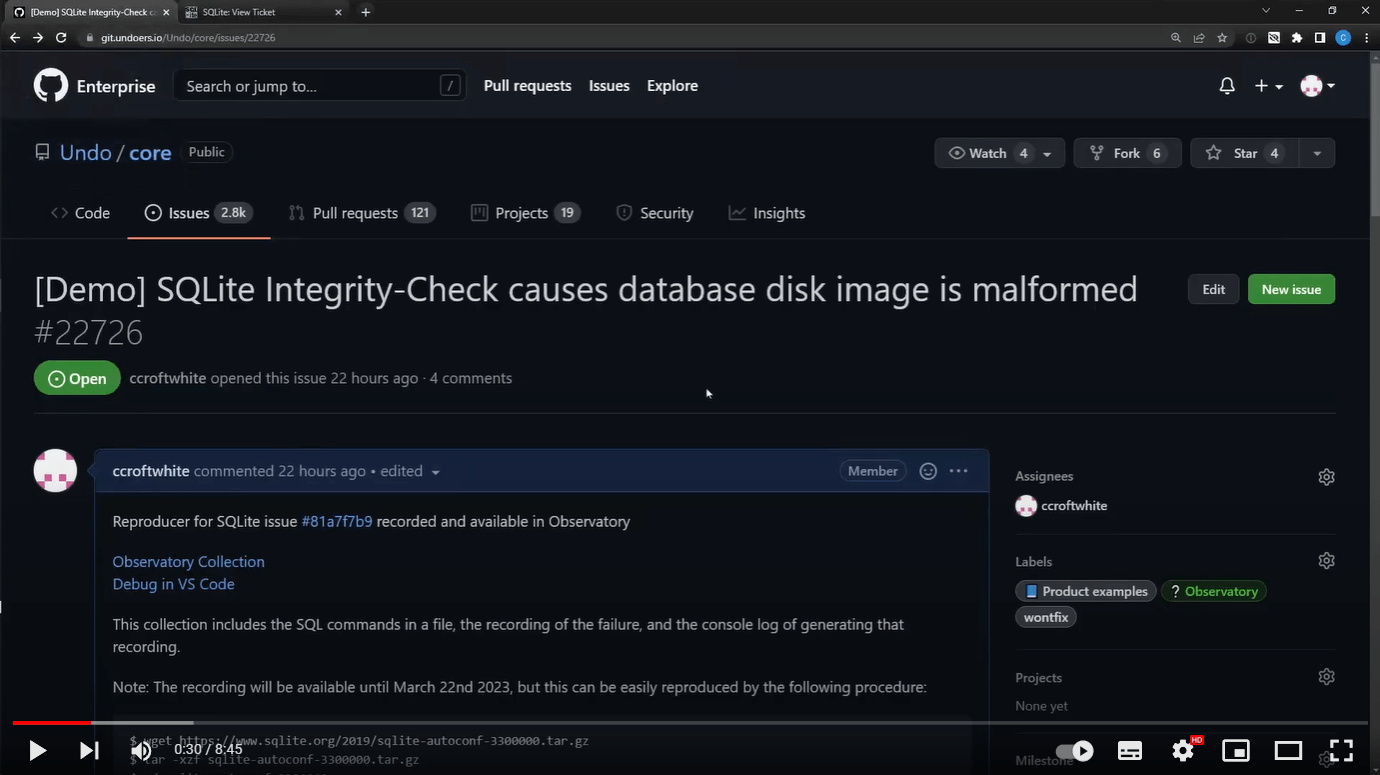
This ticket included 2 hyperlinks:
- One link to the “Observatory Collection” (this is just the Observatory backend)
- Another link to “Debug in VS Code”
We used the second link to start debugging the SQLite issue in the VS Code in-browser environment.
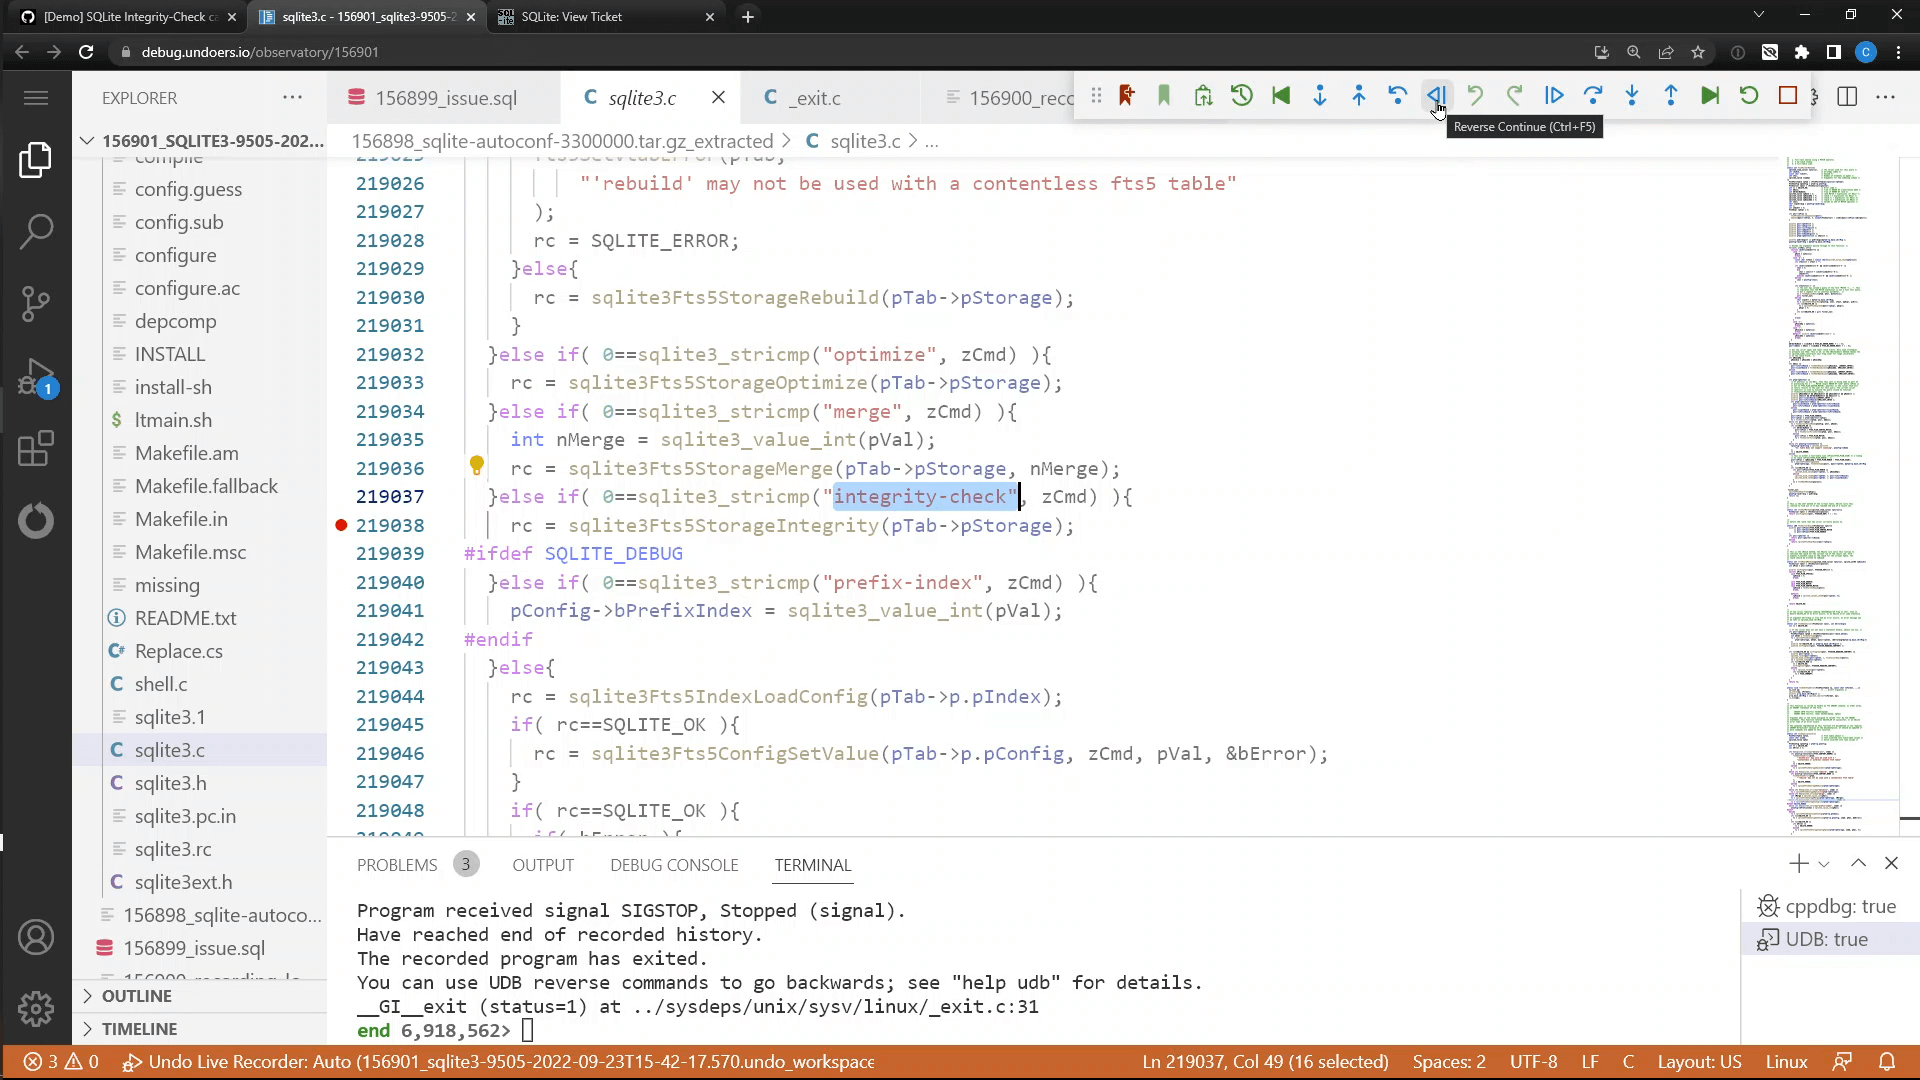
There is a lot going on here behind the scenes to enable this, and we only touched the surface in the video, so let’s look behind that curtain.
How LiveRecorder allows developers to instantly start debugging failures
LiveRecorder (Observatory) has a number of components, but essentially it allows you to register details of your builds (sources, debug symbols, etc.) along with one or more LiveRecorder recordings, so that the system can spin up a docker container with everything needed to replay and debug the issue using VS Code. This avoids any challenges in getting the correct sources or keeping track of build symbols for stripped builds.
If this system is integrated with your CI or automated test environments, in the event of a test failure it can automatically generate a recording and register it, as well as the sources, symbols, logs, etc, and then create a ticket with the relevant links for the developer. The engineer assigned can then open the ticket, click on the “Debug in VS Code” link, and be presented with the recording loaded in a VS Code session with the correct sources ready to be diagnosed.
With this one-click workflow, the engineers don’t have to review the test case details to understand exactly what the test was trying to achieve, or even what would be needed to replicate the environment in order to reproduce the failure. They also get the correct source code versions and any additional debug symbols deployed and available within the VS Code session.
This shortcuts the entire understanding and replication process and gets engineers directly to the failure analysis.
Even without the benefits of time travel debugging, this will be a significant energy- and time-saver for developers. (There is plenty of content covering the benefits of time travel debugging when diagnosing issues, so please see the SQLite video as a starting point for that.)
So developers can save a lot of time and effort during debugging and root-cause analysis. Inside the VS Code environment, everything behaves much the same way as in native VS Code with Undo’s extension. It also offloads all the heavy lifting to the cloud, as developers can work purely through a web browser.
Asynchronous collaboration
Now let’s look at the enterprise/team features. Pretty obviously, any link you can click, so can a colleague; so multiple developers can work simultaneously on the same issue even if the original replication required limited resources. This works whether you are sat next to your colleague or across the planet from them. While not used in the video, there is a button (see below for our newly updated toolbar) on the time travel debugging toolbar which can save a link to your clipboard.

This link allows someone to open a debugging session at exactly the location you are currently at, which allows you to add comments to the ticket, tracking your analysis, enabling you or others to pick up where you left off (for example, when you receive an unexpected return value from a module maintained elsewhere).
Here is an example of just such a comment from the SQLite example. You can not only give details of what you did, how you got there (which is helpful for others to understand your actions), but also, the link you see in this comment will open the VS Code environment with the recording loaded and stopped at exactly the point described.
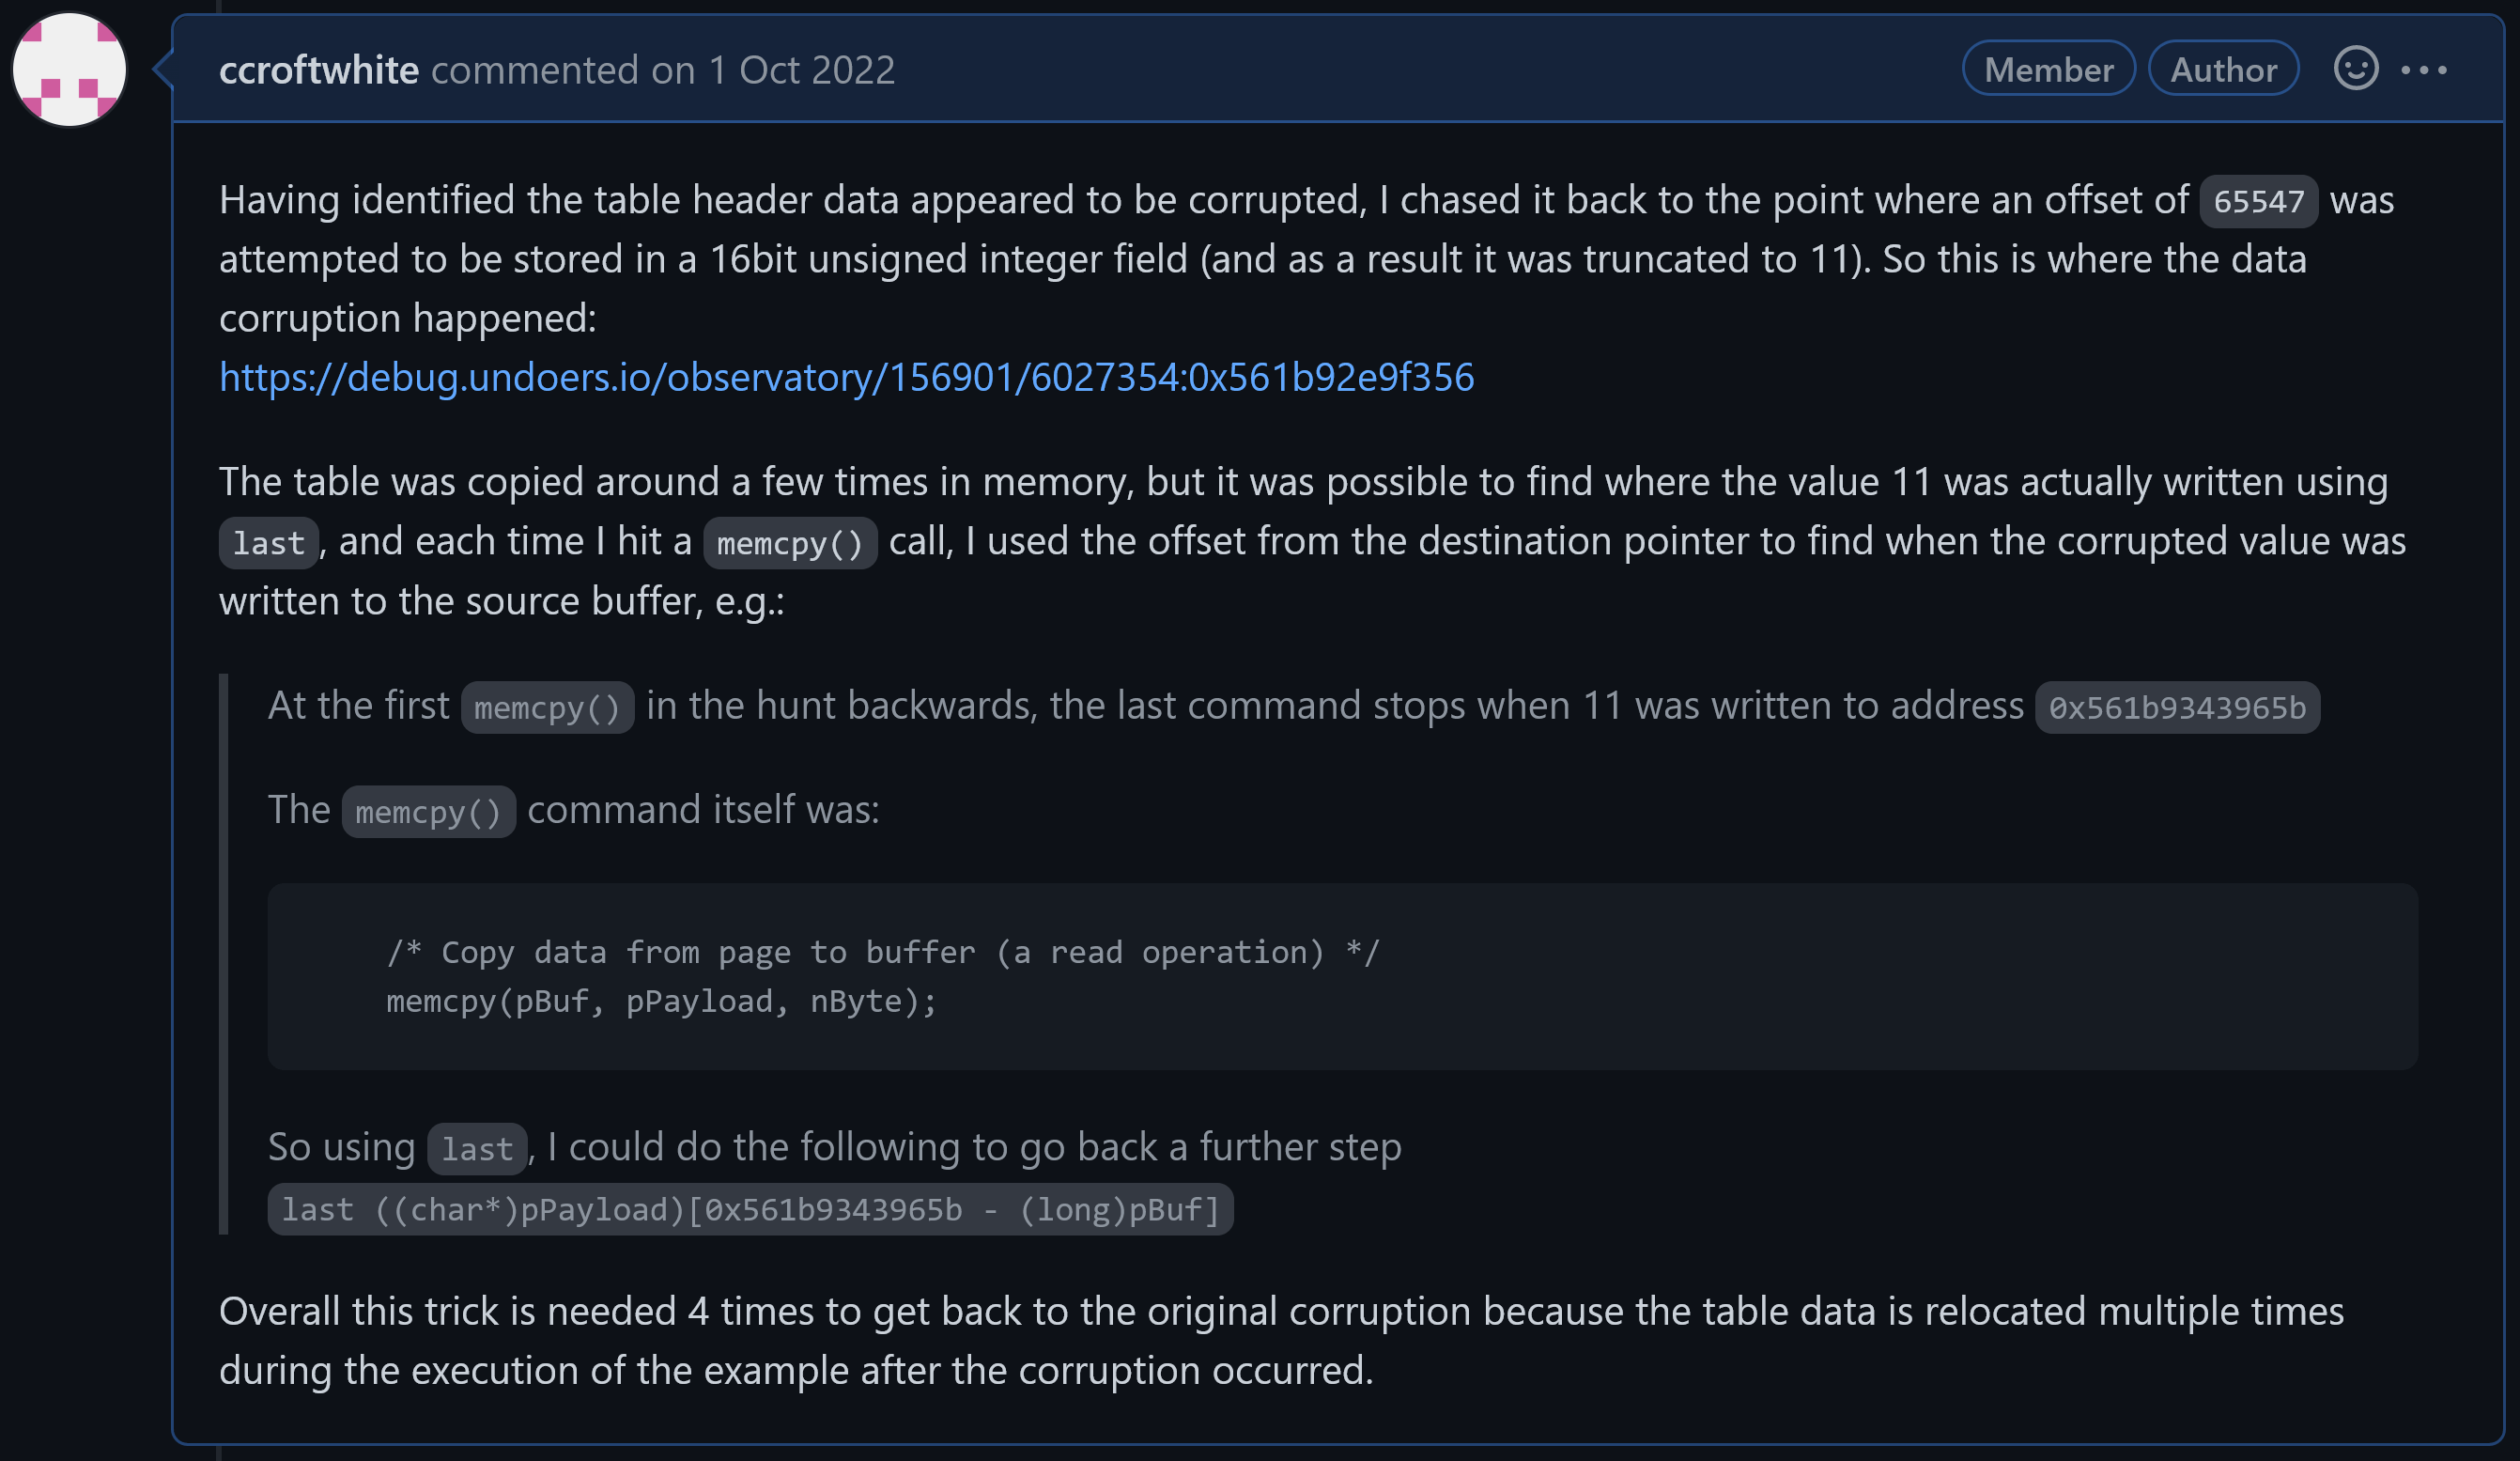
Comments like this allow you to easily hand over the diagnosis to a colleague in a different timezone to pick up, enabling easy 24-hour debugging on the same issue with an international team covering all time zones.
Collaborative debugging is just one of the ways LiveRecorder Observatory can add value. It also allows for rapid triage and allocation of issues to team members, including reallocation while saving the replication time seen above for every individual involved in the process.
Rapid onboarding of new team members
With the use of informative comments on tickets as above, and the Observatory system, experienced engineers can document how they went about tackling these issues in the bug-tracking system. With such tickets, new members to the team can simply be pointed to these tickets and they can click these links to explore and replicate the analysis done, helping them better understand the codebase, as well as the approaches and techniques used by more senior engineers to debug it.
This will rapidly accelerate the onboarding of new team members as they are able to learn directly from those with greater codebase knowledge, with minimal demands on the experienced team member’s time.
Want to see how LiveRecorder could work in your environment? Book a call with a solutions engineer.
or learn more about else how LiveRecorder boost developer productivity
Author: Chris Croft-White, Staff Solutions Engineer at Undo
