Resources
Parallel Search Speeds Up Time Travel Debugging by 4x
Introduction
One of the major new features of UDB and LiveRecorder 6.8 is an optimization called Parallel Search. This uses multiple CPU cores to provide speed-ups of up to 4x during time travel debugging.
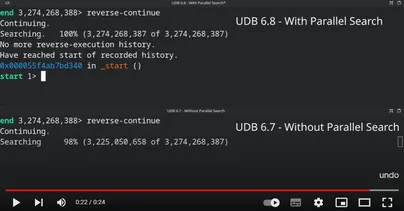
Side-by-side comparison of a long reverse-continue operation, with and without Parallel Search
In this article, we’ll describe some of the magic that makes this speed-up possible. But first, we’ll need to explain some fundamentals…
How does time travel debugging work?
Time travel debugging lets you debug an instruction-accurate recording of your software. Once captured, this can be played through forward and backward and will always behave the same way. You can see any piece of program state for any line of code (or any instruction) that has executed, making it possible to quickly diagnose difficult bugs.
A computer program is much like a railway locomotive. It has an execution path (i.e. tracks) that it will naturally follow:

The tricky part is that, when interacting with the outside world (e.g. getting input from the user) these tracks can branch:

Undo’s technology records all of the input a program receives from the outside world – whether obvious (e.g. data returned by read() syscalls) or less obvious (e.g. the precise timing of asynchronous signals, or data read from shared memory).
Not only can we record this, we can replay it so the program will execute the same way, every single time.
Using Just-In-Time instrumentation of machine code, our engine can efficiently catch all the places that the program might encounter non-deterministic data – no changes to the program are required (not even re-compilation).
How does reverse execution work?
So, we can replay things – and they’ll always act the same. But how do we run things in reverse? Computers can’t run backward. Some operations like i++ are reversible. Most however, e.g. a = b are not – whatever was in a prior to that assignment is gone forever. (Actually, even i++ isn’t always reversible – consider the flags register of the CPU.)
The secret here is that the program never really runs backward. The Undo Engine’s “Search” algorithm uses deterministic replay to efficiently provide the illusion of reverse execution.
- When the user asks to run backward, they’re really asking “what is the most recent time <event of interest> happened?”. The event of interest might be the last time a particular line of code was run (a breakpoint) or the last time some data changed (a watchpoint).
- Because we can replay the program’s execution, we could answer this question by running the whole execution history again and noting down each time this event occurs. We would then move the user’s debugging view to the previous event of interest.
- The drawback to this approach would be that, even when we don’t move backward very far, we still have to replay the entire recording.
To make reverse execution practical, the Undo Engine maintains snapshots of the program at different points in time; it can jump instantly to the time of any snapshot. Our Search algorithm is responsible for efficiently jumping around in this history and finding the most recent time something interesting happened – this gives us the illusion of running code backward.

Our engine’s supervisory “Nanny” process manages multiple “Snapshot” processes, representing different points in history. The gap in history between two snapshots is called a “slice”
Our algorithm divides history into slices – each slice is the gap between two snapshots. By replaying each slice, starting from the most recent and working backward, the Engine minimizes the amount of history it needs to replay. If a breakpoint or watchpoint was hit during a recent slice then no earlier slices need to be checked. This significantly reduces the time taken for small backward steps. (Note, though, that we still need to check the remainder of that slice in case there’s a better match)
What about large backward steps?
This algorithm allows us to minimize the amount of replay required to execute in reverse – it works especially well when we’re making a small step into the past.
When debugging real systems it’s often necessary to rewind history a long way – perhaps you have a simulation job and you’re using a watchpoint to find memory corruption from way back.
The faster we can travel back in history, the faster you can solve your bug.
Introducing Parallel Search
Parallel Search extends our existing Search algorithm by using multiple CPU cores to accelerate reverse execution. With four CPU cores this can cut down wait time by up to a factor of four. This means that we can rewind your program up to 4x faster than it took to record.
The replayable slices that make up recorded history each begin at a snapshot of the program’s state. We can resume execution instantly from any of these. We also guarantee that replay will always have the same result because we precisely reproduce all non-deterministic operations: everything is on rails, just like our locomotive.
Given this, there’s no reason we can’t run several slices independently, at once – they’ll all replay precisely as they originally did. This is exactly what we now do.
Running backward, in parallel
Each slice is an independent chunk of program history so, in principle, we could run them all at once, then pick a winner.
In practice, this would not be optimal: we’ll typically have more slices than available CPU cores. Our implementation arranges the slices into a queue that feeds multiple workers running in parallel.

Our engine runs multiple slices of execution history in parallel, allowing us to cover more of a recording in less time.
- As soon as any worker finds a match, we know the earlier slices cannot possibly provide a better match. We could just let them run to completion but this wastes system resources and, if they take a long time, could delay our response to the user.
- When a slice finds a matching event we will stop any work (including in-progress work) on earlier slices. We still wait for all later slices to complete – they could still provide later events of interest, which we’d need to report to the user.
Parallel Search in UDB v6.8
In UDB and LiveRecorder v6.8 we have capped the number of workers at a maximum of 4. This should give a good performance boost, while limiting overheads. We hope to increase this in future, taking advantage of larger systems where possible.
Note: After loading a LiveRecorder recording file UDB may require a few operations to warm up the snapshot state and achieve maximum performance.