Boost developer productivity
Reduce debug cycles down to just 1 build
Limited engineering resources
Under pressure to ship quality products faster, but with ever more limited resources?
If you have a hiring freeze (or worse, a reducing headcount), boosting developer productivity is likely to be your most urgent priority.
In Developer Productivity Engineering (DPE), the focus has been on improving build and test cycle turnaround times. It’s a good starting point. But what if you could also reduce the number of build cycles, rather than just get builds to run faster?
Fewer builds, rather than just faster builds
All too often, when a test fails, a lot of time is spent trying to get enough information to diagnose the issue through an iterative cycle of: add logging, rebuild, wait for the build cycle to complete, rerun (potentially multiple times until the failure reproduces), and examine the new logs. Not enough information? Add more instrumentation, rebuild, wait until the code compiles again, etc.
Each iteration in the search for diagnostic information requires another build and another round of idle time. It’s not uncommon for developers to have to go through 5–10 of these iterations over several days before the root cause of the bug is identified.
Debug with just 1 build
Undo’s time travel debugging solution is used by developers to save time on diagnosing the root causes of new regressions, legacy bugs, and flaky tests on complex codebases.
With Undo, developers can reduce the number of these build cycles down to 1.
Here is how:
- When a CI/system test fails, a recording is automatically created: the recording captures the execution of a failing test run. It is stored in your CI or bug tracker – ready for analysis at any time.
- By clicking on that recording, developers can then replay that recording by simply clicking on it. They will jump straight into a ready-to-go, fully set-up time travel debug session in a web browser.
- In the web-based debugger, developers can now go back to any point in the execution history to inspect application state (including contents of all the variables and the heap) and see exactly what their software did. At that point, developers can even log additional variables to cater for “I wish I had logged that other variable” moments, and see what the output would have been, without needing to rerun.
Developers get all the information and all logs they need from one single build. This represents a huge productivity saving. It also means developers can deliver their code changes faster.
WATCH VIDEO ABOVE: How to diagnose software failures with a single build and test cycle by using time travel debugging and dynamic logging of a recording i.e. logging additional variables after your program has run to see what the debug output would have looked like – without needing to rerun.
Undo is an innovative tool which really eases the debugging process and elevates productivity.
Ajit Kumar Rajak, Senior Software Engineer at Juniper Networks
Fix your flaky tests problem
Your build cycle might be faster, but are those tests reliable? If tests come back in 20 minutes but are not reliable, you’re not solving the problem of improving developer productivity.
Flaky tests are one of the biggest hurdles in maintaining a reliable test automation framework. They are also a productivity killer.
Explore how time travel debugging enables developers to fix flaky tests more efficiently.
Reduce time spent on debugging
There’s a heavy focus in Developer Productivity Engineering (DPE) on improving build and test cycle turnaround times. But what about the elephant in the room: time spent on debugging in the local development loop, as well as debugging CI test failures, overnight test failures, and system integration test failures?
Do you know how much time your software engineering team spends debugging in a 12-month period?
Depending on which research you look at, developers say they tend to spend 25–50% of their time per year on debugging. That is 25–50% of developer time not spent on more creative, enjoyable work – like programming and building new features.
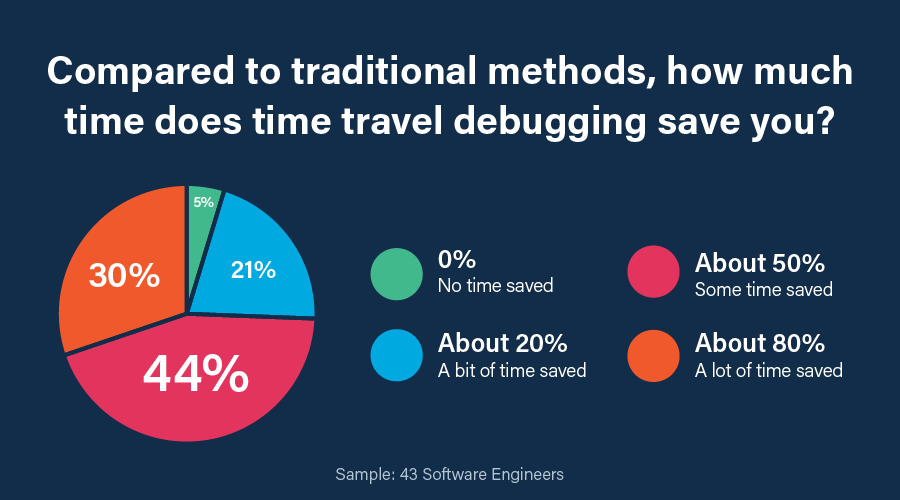
74% of time travel debugging users report a time saving of 50–80% when using time travel debugging compared to traditional methods like logging, printf, and standard debuggers.

Book a call with a Solutions Engineer
If you’d like to have a chat with one of our Solutions Engineers about whether Undo could work for your specific use case, you can request a quick call below.