Boost developer productivity
Reduce time spent on debugging
Time spent debugging software
Key insight
Do you know how much time your software engineering team spends debugging in a 12-month period?
Depending on which research you look at, developers say they tend to spend 25–50% of their time per year on debugging. That is 25–50% of developer time not spent on more creative, enjoyable work… like programming!
If you have a hiring freeze (or worse, a reducing headcount), developer productivity is likely to be your most critical lever if you are to deliver changes at velocity with ever more limited resources.
Your Developer Productivity Engineering (DPE) team is hopefully already looking at how to solve the problem of the unacceptable amount of time spent debugging software – a primary barrier to development velocity.
A bit of arithmetic
Let’s pose this conservative scenario. We’ll assume that:
- your engineering team is 100 people strong
- the team spends an average of 30% of their time per year on debugging
- each engineer costs an average of $100,000 per year
That’s $3,000,000 spent on debugging every year.
Do your own back-of-the-envelope calculations; and if you don’t know how much time the engineering team spends on debugging, it’s time to find out!
The problem of reproducibility
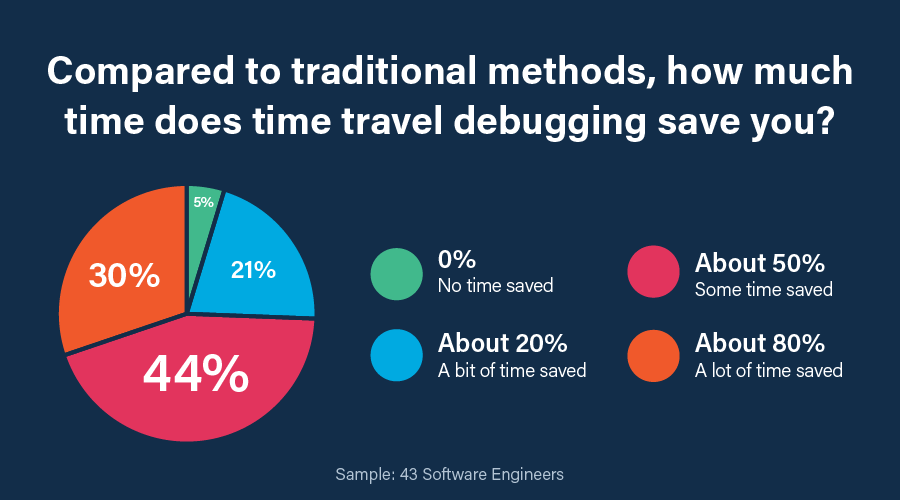
What if you could get the cost of debugging down by 50%? But, more critically, what if you could cut down the time engineers spent on debugging from 30% to 15% – allowing engineers to spend an additional 15% of their time on building new functionality, or delivering changes faster?
Give every engineer back > 30 days per year!
Sure! But how?
Well, first, let’s look at why debugging is so time consuming.
91% of software developers admit to having unresolved defects because these defects cannot be reproduced. [see analyst report]
41% say that the biggest barrier to finding and fixing bugs in their backlog faster is to get the bug to reproduce. [see CI research report]
In other words, reproducibility is the fundamental technical problem that absorbs the bulk of the time in debugging. It also happens to be the most frustrating part of the job. When a failure in QA lands on an engineer, it takes time to figure out whether the failure is a new regression or not, then figure out where to start, and how to reproduce the problem. At the point when engineers pick up a bug to resolve, they often can’t know how long it will take to figure out the root cause.
The uncertainty is uncomfortable and can increase levels of stress and anxiety. This unpredictability seriously affects software team’s ability to deliver and doesn’t offer a conducive environment for developer happiness. Diverting developers away from the more rewarding and creative tasks of new feature development is often seen as among the major reasons for high turnover in software engineering.
Time travel debugging
Time travel debugging solves the problem of reproducibility. We explain further down in what way it does this, but first, let’s define what time travel debugging is.
What is time travel debugging?
Time travel debugging is the ability to wind back the clock to any point in an application’s execution and see exactly what it was doing. Among other things, developers can :
- Inspect the complete state of the application at any point in time including the contents of all variables and the heap.
- Navigate their application’s execution using the full range of debugger functionality – stepping, running, breakpoints, watchpoints, catchpoints, etc. – but in reverse as well as forward.
- Run backward to trace when and how a variable or memory location was last changed (e.g. by using reverse watchpoints).
There’s more to it, but that’s the basic principle. Learn more about time travel debugging.
How does time travel debugging reduce time spent on debugging?
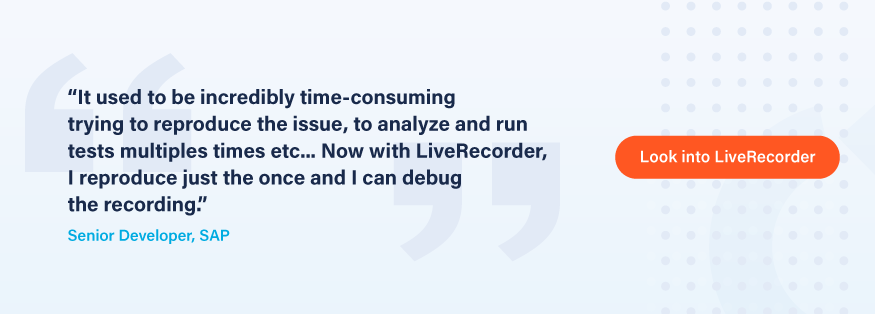
Time travel debugging provides engineers with a recording of a test or production failure. Having the recording is like having the complete movie at your fingertips (instead of a bunch of still snapshots to piece together for clues). No time needs to be spent on manually trying to reproduce the problem. The bug is captured in the recording. And the recording will always behave the same way… for everyone. No more “Works on my machine!”
Engineers can travel back in the code execution from the symptom directly to the root cause. Developers analyze the recording and see what the software really did and where it diverged from what they expected. (as opposed to what it was expected to do).
In short, time travel debugging makes debugging way more predictable, compared to using traditional debugging techniques such as logging, core dumps, print statements, or standard debuggers.
Last but not least, by allowing all developers to explore how the code is executed (every line of code in every thread, every variable, every I/O), junior developers or developers new to the codebase can solve complex bugs just as efficiently as more experienced team members.
“Everyone who debugs C/C++ should be using time travel debugging. If you’re not using it, you’re just wasting time.”
Brian Janes, Senior Engineering Director, High Performance Computing at Altair

Time travel debugging tools
There are several time travel debugging tools available:
- Microsoft’s time travel debugging tool for Windows C++ applications
- Replay.io for web applications
- The rr open source tool for debugging Linux C/C++ and Go programs (perfect for smaller, less complex applications)
- Undo is used for debugging more complex Linux C/C++, Go, and Java programs (multithreaded or multiprocess applications, applications using shared memory or async I/O, operating in the cloud or on a VM)
Make bugs 100% reproducible with Undo
Undo makes bugs 100% reproducible.
Undo provides a one-click workflow from a test failure to a time-travel debugger placed exactly at the point of failure – skipping the tedious steps usually required to reproduce the problem and enabling developers to start debugging test failures instantly.
Developers working on complex C/C++, Go, and Java software can now save a huge amount of time diagnosing the root causes of new regressions, legacy bugs, and flaky tests.
Bugs that took days or weeks to fix can now be resolved in hours.
- Record CI / System Test failures to capture the execution of failing test runs, including intermittent failures; store the recordings in your CI or bug tracking system for later analysis and cross-team collaboration.
- Replay recordings: jump from the test failure (or bug report) straight into a ready-to-go, fully set up time travel debug session in your web browser.
- Resolve bugs fast by tracing from symptom to root cause in one cycle: go back to any point in the execution history to inspect application state (including contents of all the variables and the heap) and see exactly what your software did.
7 reasons why Undo boosts developer productivity
- Capturing the issue is automated – eliminating the need for engineers to go through the hassle of trying to manually reproduce the bug and making it less taxing for developers to work out how to get started with a bug.
- Developers can start debugging instantly by simply clicking on the recording link in the CI dashboard or bug tracker (one-click workflow).
- Engineers can debug in a modern, easy-to-use IDE (more accessible for developers who don’t like command-line debugging).
- Recordings are shareable for effective remote and asynchronous collaboration: QA team members can share recordings with developers, and developers can share links with colleagues anywhere in the world to specific moments in time in the recording, share bookmarks, and add comments in recordings.
- Context switching costs are reduced: it’s expensive for developers to take a CI failure and work out a what’s gone wrong. When a test fails, developers rarely have much information about what happened. Undo tightens this loop by providing faster feedback on test failures.
- Junior developers and developers unfamiliar with the codebase can find and fix bugs in complex software just as efficiently as your more senior developers and architects with years of experience in the codebase.
- By reducing time spent on debugging, engineering leaders can create the right environment for their team to innovate faster, free up developers to focus on delivering value, whilst boosting developer happiness and retaining talent.


