Resources
A complete example: debugging an open source program with LiveRecorder
Last year, we explored a SQLite data corruption bug using LiveRecorder and UDB inside Visual Studio Code, which can be found here. That article and video shows the full analysis of the issue at the time.
With new developments on LiveRecorder and UDB as part of the 6.9 release, we wanted to revisit this issue as an example of how to use the technology to investigate such an issue, without relying on code familiarity.
Here is the updated video:
Below is a step-by-step guide to what I am doing in the video.
We start with the summary of the original issue (the SQLite ticket). In this case the recording, sources, logs, and test case were hosted within LiveRecorder Observatory. The latter integrates a web-based debugging platform with the bug-tracking system, which includes tickets generating a link for developers to immediately start debugging and analyzing the issue in a Visual Studio Code session.
Once opened in VS Code, the issue is essentially as before; however, in this example, we take a couple of additional shortcuts, the first being searching directly for the function which raised the error.
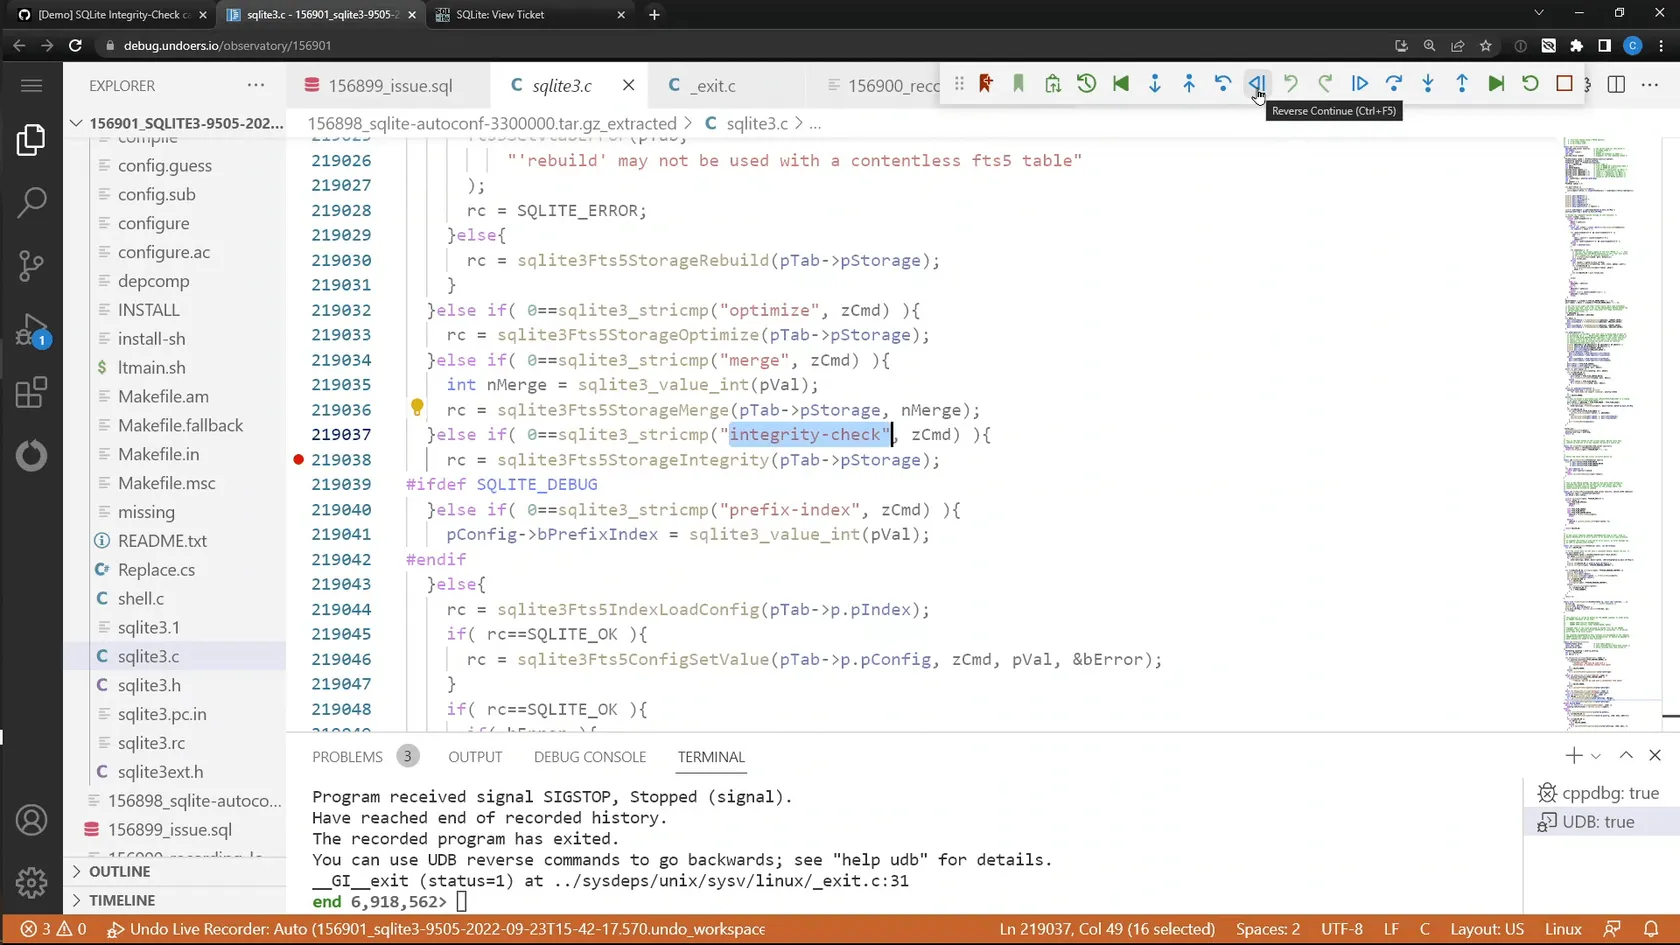
This was simple, as the SQL command which raised the error involved running an “integrity-check” on the table, so we went straight to searching the codebase for this specific string. This quickly got us to the integrity-check functions (we set the two breakpoints as it’s not obvious which was the source of the error in this case).
Having confirmed that the integrity-check function returned the error code which was reported, we start going backward into the function to find out where it was detected. After a few steps, we find out that the end of the function reports the error detected earlier in the execution; so at this point we break out the new last command. last allows for the user to quickly and easily run a recording backward to the point where the value of an expression last changed.
We see in the original analysis that it used to take more effort to ensure there were no other breakpoints or watchpoints, set a new watchpoint on a location, and reverse-continue to it.
The last command manages all of this, temporarily disabling other watchpoints and breakpoints (running backward and restoring any breakpoints, etc, afterwards), reducing the additional effort taken and allowing the user to just run backward to the point where the interesting value was modified.
Using last we are able to find where the error was detected. At this point we explore the circumstances which cause this error to be raised. Essentially, the metadata was packed at the start of the table but, when validating it, a corrupted value caused the error to be detected.
Exploring the values, one stood out as being suspicious. The size for what should probably have been the majority, or at least substantial part of the whole table (which in total was just over 64K bytes), was being read as just 11 bytes.
This was especially suspicious as the total size of the table was 65,568 bytes (32 bytes more than 64KB), and the 11 value was read with a getU16() function. Unsigned 16-bit integers can only hold values between 0 and 65,535, so it’s very possible this 11 value might have been corrupted if it was actually supposed to be more than 65,535.
Again, last was very helpful here to track the 11 value back to the point where it was written into the data structure. As you see in the video, the table gets copied around in the SQLite memory a few times with memcpy() between the value being stored and the error being detected, but using a simple pattern it was easy to trace it back through the memcpy() calls.
After a few steps, we get back to the putU16() function call, and confirm the value it was attempting to store was 65,547, which gets cropped to 11 when cast to an unsigned 16-bit integer.
6:55 minutes into the debug session – and we have found the corruption! But why did this happen?
Yet again, using last we can go back to see when the 65,547 value was last updated. We found there was code attempting to validate that this 65,547 size would not exceed the configured page size; however, the configured limit was 70,000, which is above the maximum 16-bit unsigned integer value and thus allowed this integer overflow to happen.
We again used last to see where this 70,000 limit was configured. At that time, the 70,000 limit was checked against a FTS5_MAX_PAGE_SIZE value which had been set to allow up to 128KB pages. Looking back at the original SQLite ticket, we can see that the solution implemented was in fact to change this FTS5_MAX_PAGE_SIZE limit we located to 64KB, so that sizes would not exceed 16-bit values.
This diagnosis was definitely made faster and easier by the new last function, as the user no longer needs to spend time navigating existing breakpoints and watchpoints to get to the specific definition they are looking for.
As soon as you start to diagnose these sorts of issues with last, it becomes natural to start to think about debugging in terms of what last <expression> will get me to the next insight into how the application got here.

