
Resources
We Let AI Debug a GDB Crash – Experiment Results
Author: Marco Barisione, Principal Software Engineer at Undo
Debugging is supposed to be one of AI’s emerging superpowers. To test this claim, I gave two leading AI coding agents a non-trivial challenge: troubleshooting a use-after-free error that causes the GNU Debugger (GDB) to crash.
The contrast was striking: when equipped with a deterministic recording of the program’s execution, both agents diagnosed the issue perfectly on the first attempt. Without this recording – even when allowed to add logging, recompile, and re-run the program – they failed every time.
Same models, same codebase, same commands. The only difference was access to a replayable recording of what the program did – made possible by the execution trace produced by time travel debugging technology. This experiment highlights something important: LLMs don’t struggle with reasoning; they struggle with guessing.
The GDB use-after-free bug
I was working on our Undo tool – part of which is built on top of GDB and involves a lot of custom Python code – when I suddenly came across a bug that caused GDB to crash:
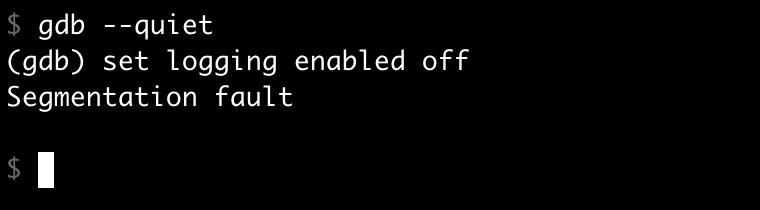
What’s your next move when this happens? You could run GDB under a traditional debugger like GDB itself, and examine the backtrace. Except the code at the crash site looks perfectly fine – the implementation of set logging enabled off is completely reasonable. The backtrace doesn’t tell you why it’s crashing.
After some investigation, it turned out that the bug involved GDB’s internal logging mechanism and how it interacts with Python. The crash could be reproduced with a specific sequence of actions:
- Enabling logging via
gdb.execute("set logging enabled on", to_string=True)in Python. - Invoking the
set logging enabled offcommand directly.
The to_string=True argument captures the command’s output as a string instead of printing it to the terminal – useful when you want to process command output programmatically without cluttering the user’s screen. You should be able to reproduce it yourself with these commands:
$ gdb

python gdb.execute("set logging enabled on", to_string=True)

set logging enabled off
The issue wasn’t straightforward to track down, so I was curious how the AI would fare. For the sake of comparison, I created a reproducer that enables logging via a GDB initialization file to keep it realistic and similar to my bug, but small and without the irrelevant UDB-specific parts. I added this to my ~/.gdbinit file:
python

import os

if os.environ.get("DISABLE_LOGGING", "0").lower() not in ("1", "true", "yes"):

   gdb.execute("set logging enabled on", to_string=True)

end
This GDB script is loaded at startup and executes Python code that conditionally enables logging based on an environment variable. With this setup, the crash isn’t immediately traceable to the initialization file, making it a more realistic bug – how often do customers give you such a simple reproducer?
Technical deep dive: what went wrong
For those interested in the technical details, here’s what the bug boils down to. If you’re not interested in the specifics, feel free to skip to the next section.
The crash was a classic use-after-free involving a stack-allocated object:
- Stack object creation: Calling
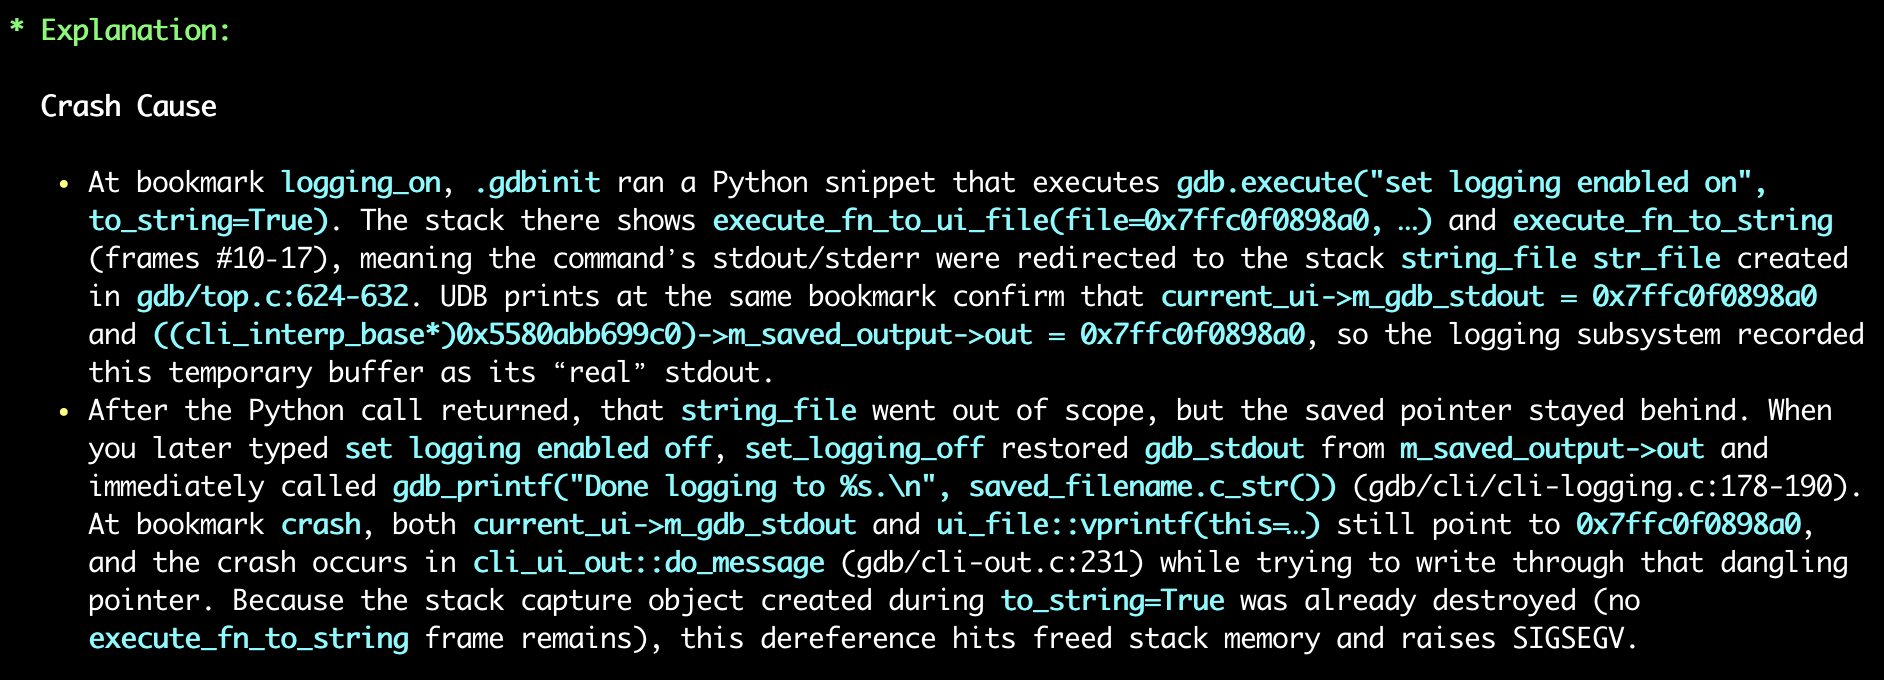
gdb.execute("set logging enabled on", to_string=True)from Python causes the C++ functionexecute_fn_to_stringto run. This creates a stack-allocatedstring_fileobject (a file-like memory-backed string) to capture the command output. - Temporary stream replacement: Then, the
execute_fn_to_ui_filefunction temporarily replaces GDB’s global output streams with this stack-allocated object usingscoped_restore, a RAII helper that automatically restores the original value when it goes out of scope. - The bug: While these temporary replacements are active, the
set logging enabledon command executes. Thecli_interp_base::set_loggingfunction saves the current stream pointers (which now point to the stack object) into them_saved_outputstructure for later restoration when logging is disabled. - Stack object destroyed: When
execute_fn_to_stringreturns, the stack-allocatedstring_fileis destroyed and thescoped_restoreobjects restore the original stream pointers. However,m_saved_outputstill contains pointers to the now-destroyed stack object. - Use-after-free: Later, when
set logging enabledoff executes,set_loggingattempts to restore the saved stream pointers fromm_saved_output, settinggdb_stdoutand other streams back to the invalid, freed stack address. - Crash: When GDB attempts to print “Done logging to gdb.txt”, it tries to call a virtual function on the invalid stream object, causing a segmentation fault because the vtable pointer now points to corrupted stack memory.
What makes this kind of issue hard to debug
This type of bug is common in real-world development, with characteristics that make debugging challenging:
- Misleading symptoms: The crash happens during an apparently innocuous operation. The error message and stack trace point to where the failure occurred, not why. A core dump shows the immediate problem but gives no hint about the root cause.
- Separation between cause and effect: The problematic code runs successfully and returns normally. The crash happens much later, after the object that caused the issue has long since been destroyed. No single backtrace can reveal the full sequence of events.
- Codebase complexity: We’re dealing with a large, mature codebase with multiple layers of abstraction. Understanding the bug requires knowledge of the internal architecture and how different subsystems interact. These characteristics are typical of complex software that’s evolved over decades.
- Configuration sensitivity: The bug only manifests with a specific combination of features and settings – exactly the kind of scenario that’s difficult to reproduce and debug. It’s the interaction between components that causes the problem, not any single piece of code.
If you’re a professional developer, this probably feels familiar. Misleading stack traces, hard-to-reproduce configurations, complex interactions across multiple layers – this is everyday debugging reality in large codebases.
Experiment 1: AI with time travel debugging (Undo AI)
I created an Undo recording of the GDB crash and fed it to our AI tool for agentic debugging – where AI agents autonomously investigate issues by examining the recorded execution, inspecting program state, and reasoning about the root cause.
Time travel debugging works by recording every step of a program’s execution – every instruction, every memory change, every thread event – and then allowing you (or an AI) to “travel back in time” through that recording to replay what actually happened. Instead of rerunning the program and hoping to reproduce the failure, you (or the AI) can deterministically explore the real execution after the fact.
I tested both Claude Code (with Sonnet 4.5) and Codex CLI (with GPT-5 Codex), using a simple prompt: “Why did GDB crash with this recording?” I deliberately didn’t provide the commands that caused the crash, forcing the agents to discover the full context themselves.
- Results: Both agents achieved a 100% success rate on the first attempt – without any further input from me.
- Method: The agents traced through the recording, identified the stack-allocated
string_fileobject, followed its address through the save/restore sequence, and pinpointed exactly where the use-after-free occurred.
Experiment 2: AI without time travel debugging
Now, could the agents do the same without Undo?
Test 1: compile and run
To make it fair, I gave the coding assistants the ability to compile and run GDB and used a prompt like this:
Doing
set logging enabledoff in GDB built from this repository causes a segfault.You can modify GDB (e.g. to add logging) and compile with […]. Use […] to run it.
Claude Code failed to diagnose the bug in a single attempt. Instead, it generated code that can only be described as creative desperation: 😬
/* Check if gdb_stdout looks like a stack pointer (on Linux x86-64,

   stack addresses are typically in the range 0x7f0000000000 to 0x800000000000).

   If so, don't save it as it's likely a temporary object that will be invalid later.

   This can happen during early command processing before streams are properly set up.  */

uintptr_t stdout_addr = (uintptr_t) gdb_stdout;

if (stdout_addr >= 0x7f0000000000ULL && stdout_addr < 0x800000000000ULL)

  return;
This is, of course, a terrible hack. It doesn’t explain the root cause; it just papers over the symptom with a magic address range check.
After prompting Claude to try again, it eventually identified that ~/.gdbinit was involved, but still failed to get to the root cause. It took a total of four attempts before it finally arrived at the correct explanation.
Codex CLI took ages to do the same work. It initially modified the code with a stack check similar to Claude Code’s approach, but then corrected itself and reached an almost-correct root cause on the first attempt. The keyword here is “almost”, as it wasn’t completely correct, and the proposed patch was overly complicated and not quite right. I prompted it twice more with substantial hints, but it kept trying to gaslight me into believing its reasoning was correct.
Worth noting: this only works because the bug reproduces locally. If it only manifested in CI, on customer hardware, or in production? The entire compile-and-rerun approach would be impossible.
Test 2: source inspection
I then tried a different approach: asking the agents to debug by source inspection, but giving them the exact sequence of operations that caused the crash:
These commands cause GDB to crash, why?
python gdb.execute("set logging enabled on", to_string=True)

set logging enabled off
Do not modify or run GDB.
This is much easier than the original reproducer and is not necessarily representative of real bug reports from customers. Surely the agents would reliably one-shot the issue now?
They didn’t!
On the first attempt, both came up with a wrong and remarkably similar explanation. They claimed the bug was in the ui_out redirection stack mechanism, specifically that ui_out_redirect_pop leaves a dangling string_file pointer on m_streams in cli_ui_out.
Repeating the experiment several times, I found that sometimes they got the correct answer, but Claude Code also offered a particularly unhelpful suggestion: to avoid the crash, don’t do the logging. Technically “correct”! 🤦🏻♂️
Success rate comparison
Here’s how the various approaches compared for root-causing the bug in a single attempt:
| Approach | Claude Code | Codex CLI |
| With Undo AI | 100% | 100% |
| Without Undo AI (compile + run) | 0% | 0% |
| Without Undo AI (source inspection with a big hint) | 20% | 25% |
The difference is stark. With time travel debugging, both agents could reliably trace through the execution, examine memory at any point, and understand the precise sequence of events leading to the crash. Without it, they resorted to educated guessing, even when given significant hints.
Cost analysis
Beyond success rate, the cost of debugging without determinism is enormous.
Using Claude Code’s built-in cost tracking (in dollars), sorted from cheapest to most expensive:
| Approach | Cost | Result | Notes |
| Claude Code: “don’t do logging” suggestion | $0.04 | ❌ | Just don’t use that feature” is not a viable bug fix; at least it failed quickly and cheaply! |
| Claude Code: source inspection, wrong answer | $0.39 | ❌ | Confidently incorrect |
| Claude Code with Undo AI | $1.21 | ✅ | Correct at the first attempt 🎯 |
| Claude Code: compile + run, 1st attempt | $2.05 | ❌ | No explanation of the actual bug and hacky workaround for the crash |
| Claude Code: compile + run, 4th attempt | $7.96 | ⚠️ | Eventually correct, but expensive and time-consuming, requiring multiple hints from me (who already knew the answer) |
I didn’t measure the cost of Codex CLI experiments as precisely as Codex doesn’t provide a single easy-to-understand number. However, the session that gave Codex CLI the ability to compile and run GDB used a total of 438,227 tokens (of which 101,476 were the more expensive output ones). According to calculations by ChatGPT using OpenAI data, this was 58 times more expensive than the Undo AI run and didn’t even produce a good answer!
In fairness, this run of Codex CLI was having a particularly bad day, but as it took almost one hour, I didn’t want to run it again! It could probably do better, but I doubt it could do 58 times better! (On the other hand, I repeated the Undo AI runs multiple times, and the number of tokens and success rate were pretty consistent.)
The flaky failure problem
This specific bug is deterministic, making it easier for agents to use an “add logging, build, reproduce” cycle to narrow down the problem. In real life, many bugs are flaky and difficult to reproduce. They might occur once in a hundred runs, or only under specific timing conditions, or only when the stars align.
This is where time travel debugging truly shines. With an Undo recording, the bug is captured once and can be analyzed deterministically as many times as needed. The agent can step forward and backward through the execution, examine the state at any point, and trace the exact sequence of events without hoping to be able to reproduce the failure. There’s no “try adding more logging and hope it reproduces”, no “maybe if we run it a thousand times”, no statistical prayers to the debugging gods. 🙏
For AI agents trying to root cause issues, this determinism is transformative. A flaky bug that might take days of human time and dozens of agent attempts becomes a straightforward analysis task when you can reliably examine the failing execution.
Key learning points
The results speak for themselves. When equipped with time travel debugging capabilities from Undo, AI agents can reliably root cause complex bugs like use-after-free issues on the first attempt. Without it, even when given the ability to modify, compile, and run code, they can struggle with multiple failed attempts, propose workarounds rather than fixes, and consume significantly more resources in the process.
For deterministic bugs, the traditional approach can eventually succeed, albeit expensively and inefficiently. For flaky bugs, which represent a substantial portion of real-world debugging challenges, the traditional approach is largely a non-starter.
The combination of AI and time travel debugging isn’t just incrementally better. It’s a fundamentally different approach to root causing issues, turning an uncertain, iterative process into a deterministic analysis task. And when you’re trying to understand why your software crashed at 3am in production, determinism is rather valuable. ⏰